The primary purpose and advantage of the Lab Scope and Graphing Multimeter, is their ability to capture, store and playback data (test signals). Having this ability can be invaluable when diagnosing intermittent issues, by providing you the ability to navigate through the data in detail to find events of interest, such as glitches and signal losses. The following sections describe the basics of the data buffer and the two basic modes of operation, Capture Mode and Review Mode.
To gain a better understanding of the capabilities of the scope and the basics of capturing and reviewing data, understanding what the data buffer is and how it works is important.
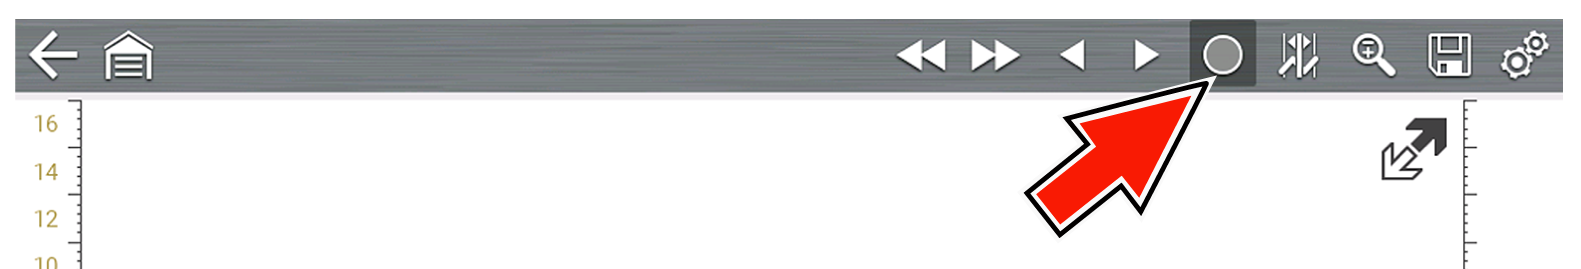
The Lab Scope and Graphing Multimeter have the capability to capture, store and playback data (test signals) utilizing internal buffer storage memory. When a test function is selected (e.g. Lab Scope > DC Volts), the data is automatically stored in buffer memory, until the Pause icon is selected.
The amount of data you can capture is limited to a predetermined “total buffer memory” size. When the buffer memory reaches its full capacity, the data buffer will continue to store new data, however earlier stored data will be removed to allow room for the new data being stored. The most recent data is always available for review when the scope is paused, and can be reviewed using the toolbar controls
As a visual aid, a graphic Data Buffer Slider is located at the bottom of the screen and indicates the position of the current displayed frame of data in relation to the entire buffer memory capacity.
In addition, a Data Buffer Position Counter displays the numerical position of the Data Buffer Slider within buffer memory.
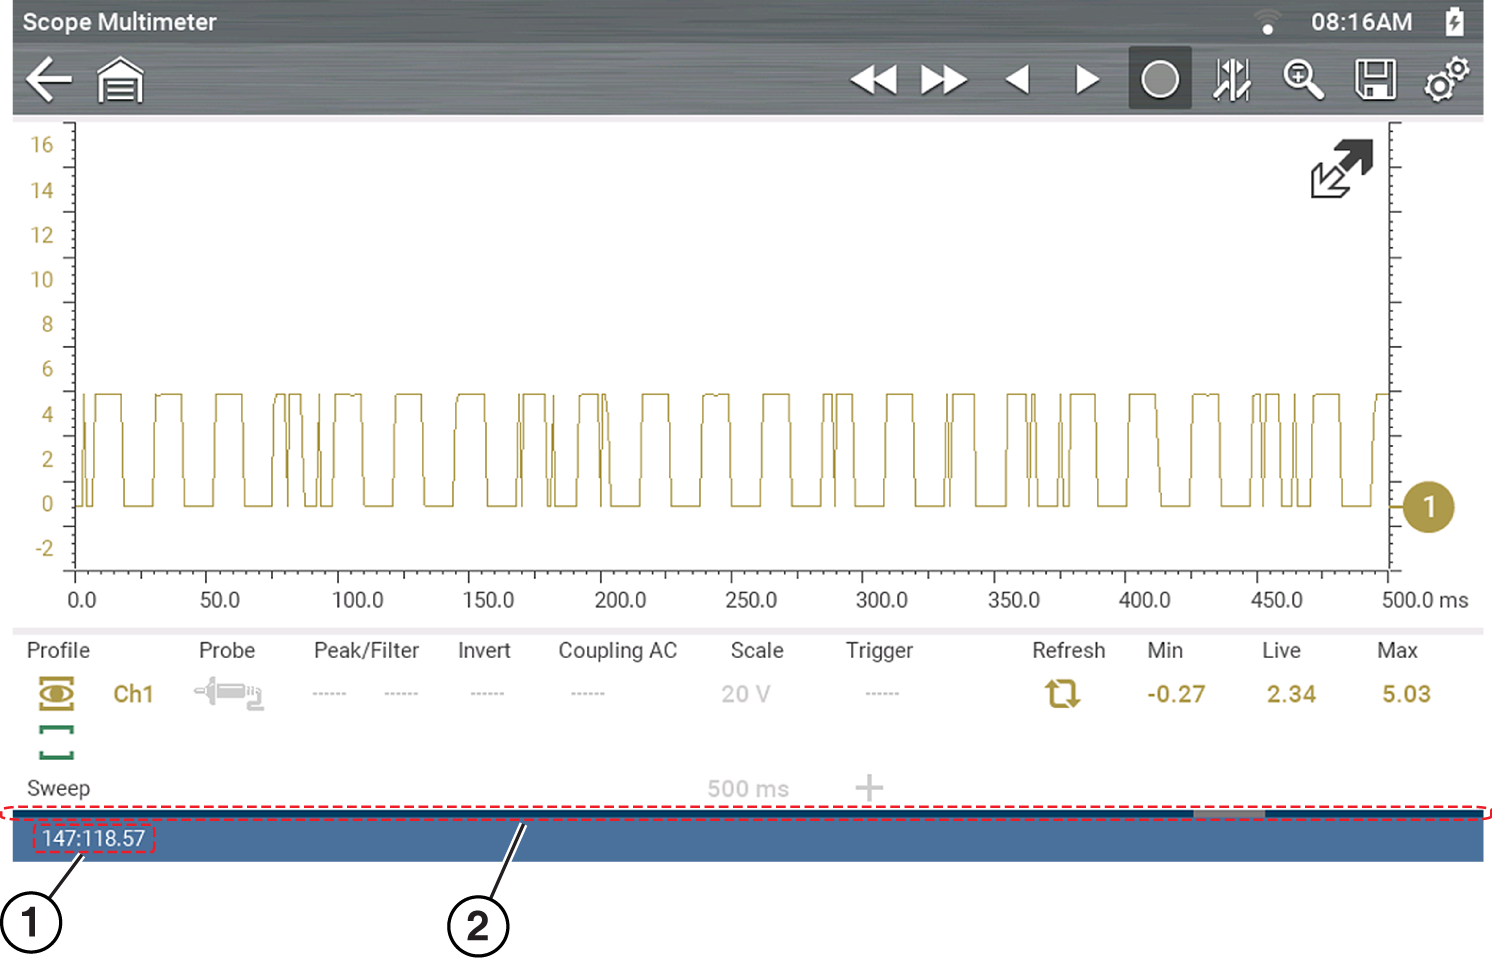
| 1. | Data Buffer Position Counter (XXX (Total memory “frames” available): XXX (Whole frame number): XX (Fractional frame number) |
| 2. | Data Buffer Slider |
Whenever you open Lab Scope or the Graphing Multimeter, the device is in Capture Mode. In Capture Mode, data is continuously being captured and stored in buffer memory at the same time it is being displayed onscreen.
Data is continuously stored in buffer memory with or without an active input test signal or trigger.
To help you understand how to work with captured data, an important concept to remember is that data is captured over a period of time. Therefore there is a direct relationship between the length of time the data is captured in, and the resultant level of detail you will have when reviewing it.
As every testing situation is different, the following is provided only as a guide when capturing data to provide the best flexibility when reviewing the data to find events.
In most situations if you start by using a sweep setting that is best suited for viewing the waveform “live”, or at a setting that provides the best detail to the naked eye, this will allow you to either see the event you are looking for “live, or allow you to use the zoom feature (in Review Mode) to zoom out (2, 8, 32X etc.) and then search through the data buffer for events of interest.
It is important to remember that whatever sweep setting you use during data capture is what the 1X zoom level will be when you switch to Review Mode. Therefore, if you capture data using a sweep setting where the pattern displayed is tightly compacted (can’t visually see detail), then when you try to use zoom you will not be able to see any detail, as you will only be able to zoom out from the setting where you originally captured the data (displaying an even greater level of compacted data).
In other situations you may need to start at a faster sweep (shorter time) to capture more detail “live”, then zoom out (in Review Mode) to get a wider view and then zoom in at the points of interest where you need more detail. Using this strategy you will capture less total time, but be able to see more detail.
For some situations, if the sweep setting you are using is not fast enough to capture the event your looking for, turning Peak Detect on will increase the sample rate and may allow you to see the event.
Using peak detect can also help in avoiding aliasing if the sweep time is too great for the waveform being captured. Using peak detect is not appropriate for every instance, but when using longer sweep settings, it can help increase the capture time by allowing you to capture more than you could without it and still capture dropouts and points of interest.
Glitches may cause drivability problems and may not turn on the MIL or set DTCs. As a general guide when looking for a suspected signal glitch, always try to verify the problem by duplicating the conditions while capturing data. Utilize the GMM to monitor the signal over longer time periods and review the histogram for possible faults.
Data continuously stores in buffer memory until the Pause icon is selected.
Selecting the Pause icon, allows you to temporarily pause the data (input test signal) to review it in detail. Reviewing the data allows you to search through the captured data in detail to find events of interest, such as glitches and signal losses.
To search through the captured data, select the desired control icon to move forward or backward through the data.
You can also swipe the screen (side-to-side) to quickly scroll through the captured data.
To resume data capture, select the Start icon (5).
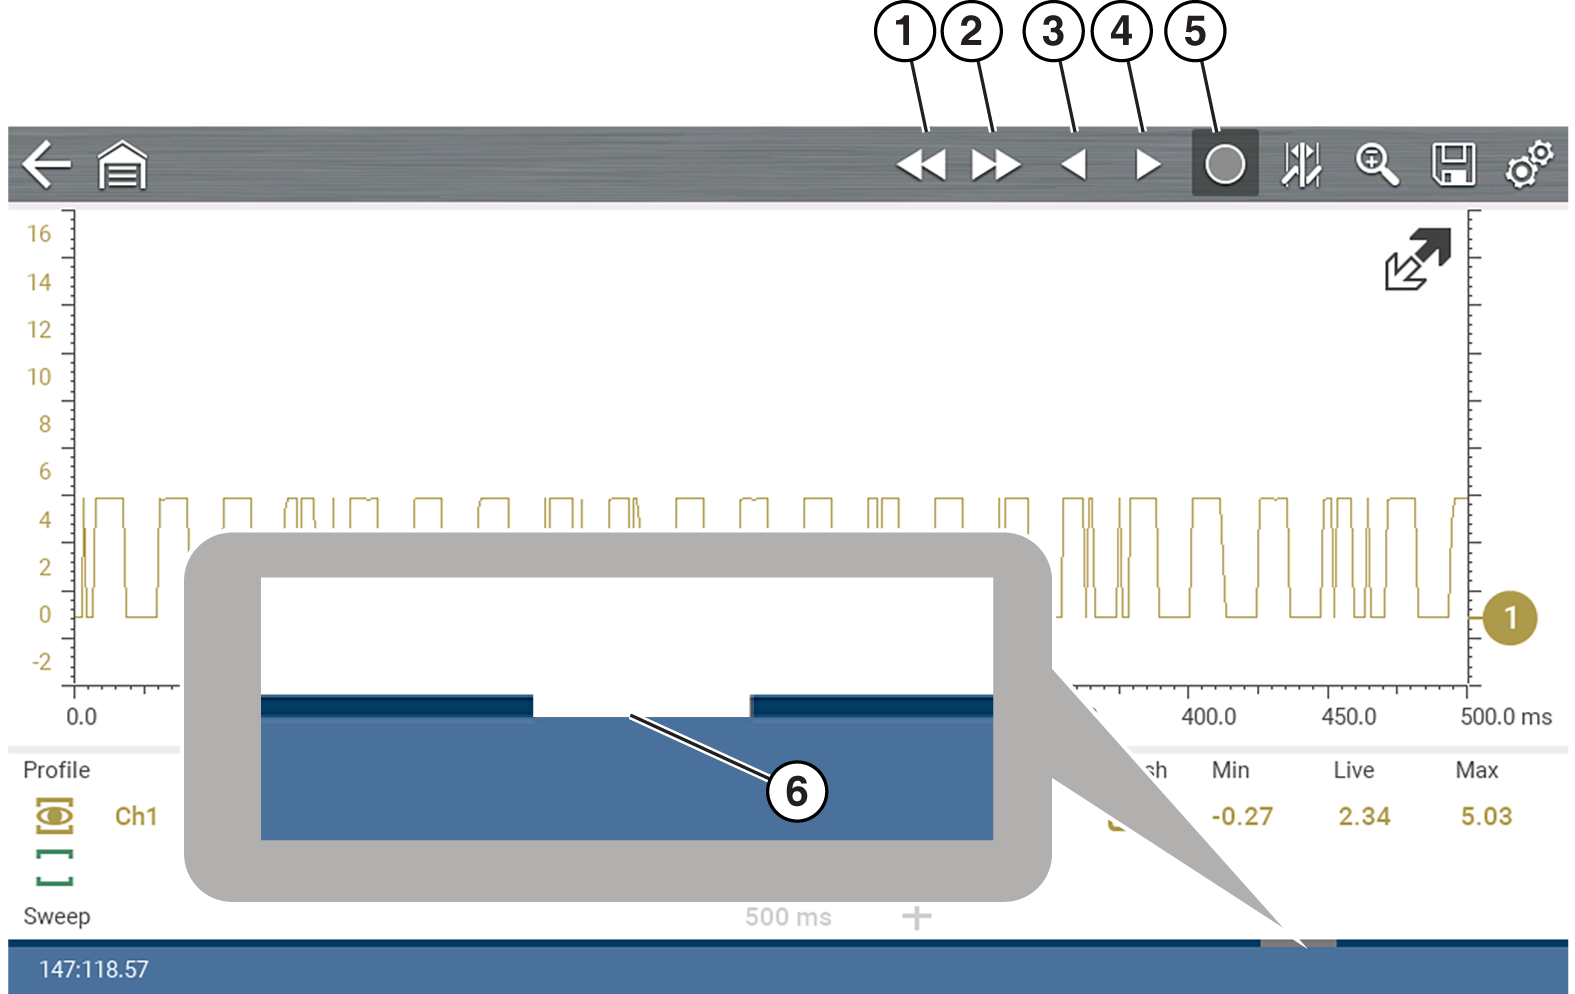
| 1. | Back 1 Frame Moves to the previous frame in the data |
| 2. | Forward 1 Frame Moves to the next frame in the data |
| 3. | Step Back Moves to the previous point in the data |
| 4. | Step Forward Moves to the next point in the data |
| 5. | Start (Capture) Resumes data capture |
| 6. | Data Buffer Slider |
File Save - Selecting the Save icon writes the data stored in buffer memory to a file. Saving data files is useful when trying to isolate an intermittent problem or to verify a repair during a road test.
File Playback - The saved file can be played back (similar to a movie clip).
Home Screen: Previous Vehicles and Data > View Saved Data
The saved file can also be downloaded to a personal computer (PC) using the Mini USB jack. Once connected to the PC, the files can be printed, transferred, and copied using ShopStream Connect. ShopStream Connect is a companion application that interfaces the diagnostic tool with a PC. ShopStream Connect is available at no cost, and can be downloaded online. See the ShopStream Connect website information at the front of this manual for additional information.
To Save Files
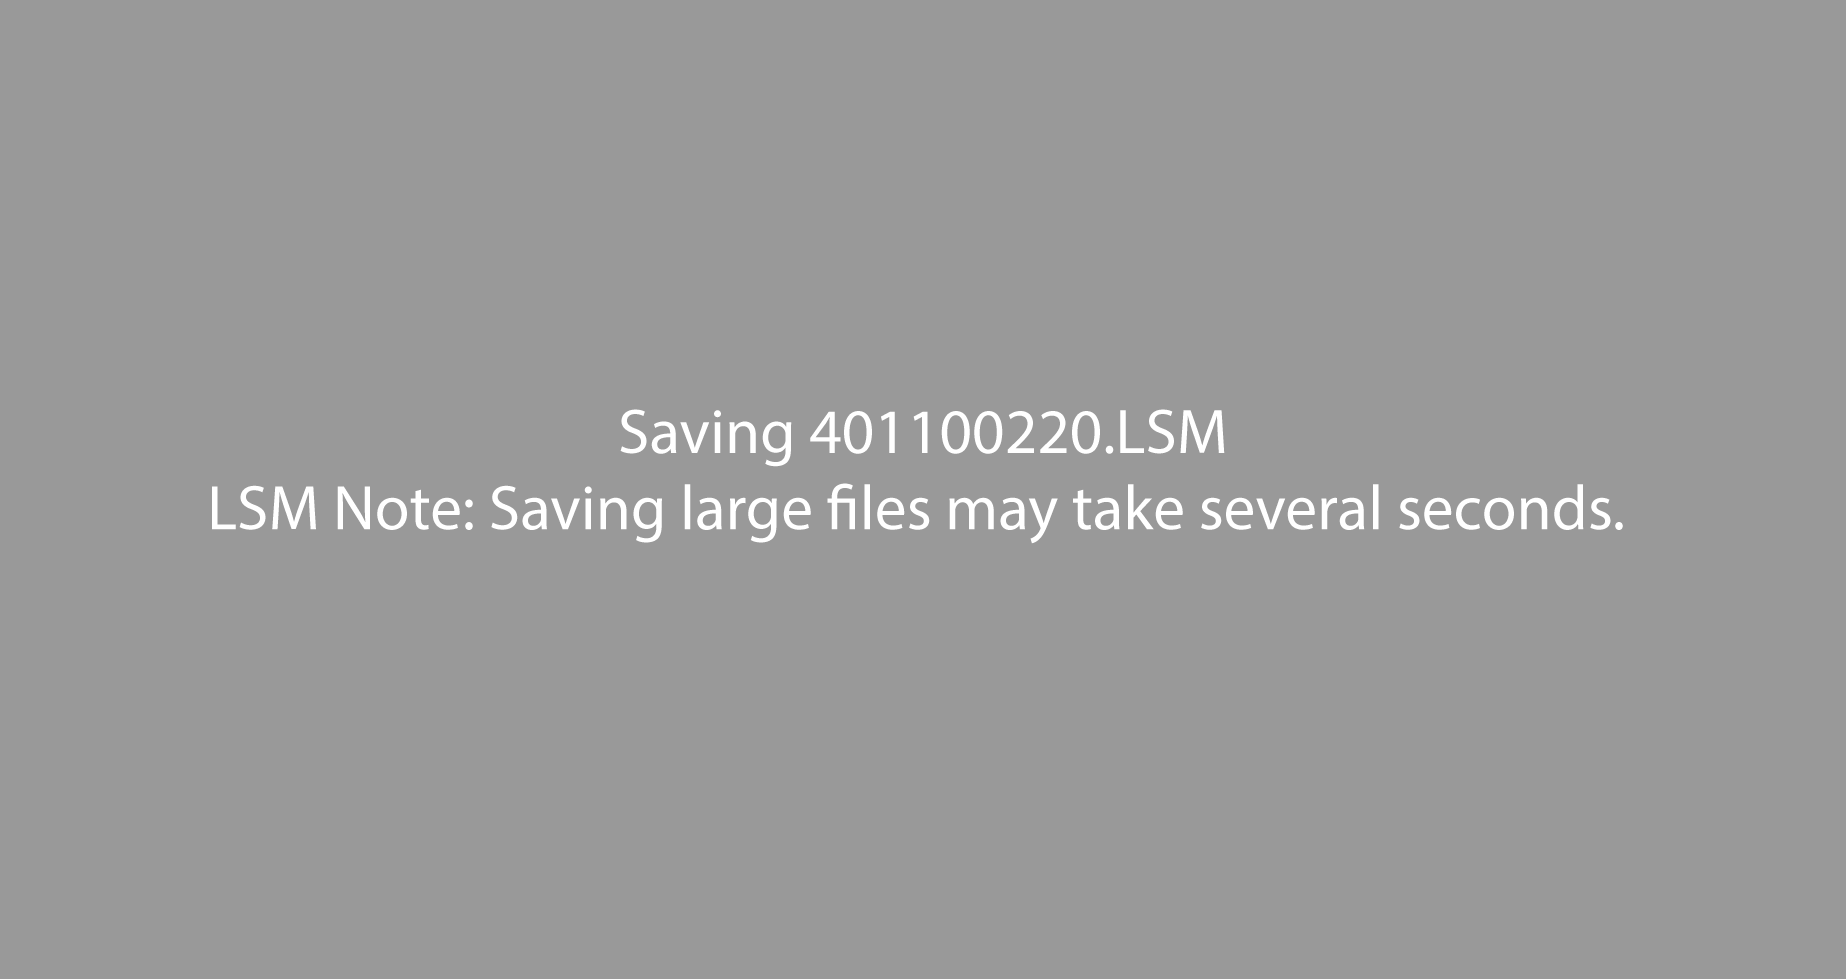
Select the Save icon from the toolbar.
A save dialog box displays while files are being saved. The file is saved when the message box disappears.
The Shortcut button can be programmed to save a snapshot (screen shot) of a visible screen as a bitmap file.
The saved file can be viewed by selecting Home Screen > Previous Vehicles and Data > View Saved Data.