The Data Toolbar contains the controls for navigating the buffered data and other options.
|
Icon |
Description |
|
Not Armed (Trigger Arm Control) |
(Flashing Icon) When this icon is flashing, the triggers are not armed and no data capture will occur. (Select this icon to arm)
|
|
|
|
|
|
|
|
Armed (Trigger Arm Control) |
When this icon is continuously displayed, triggers are armed, and ready to capture data. (Select this icon to disarm) |
|
|
|
|
Skip/Next |
|
|
|
Skips forward/back in the data buffer. |
|
Pause |
Suspends data collection. |
|
|
|
|
Start (Capture) |
Starts or resumes data collection. |
|
|
|
|
Clear |
Erases the data buffer. |
|
|
|
|
Step Back/Forward |
Moves to the previous/next frame in the data buffer.
|
|
|
|
|
|
|
|
Frame Counter |
Indicates the data buffer frame currently displayed. |
|
|
|
|
Zoom In/Out |
Increases/decreases the magnification by decreasing the sweep of the graph. The zoom options on the Data Buffer toolbar allow you to change the magnification level of the sweep when viewing data graphs. Use the Zoom In (+) icon to increase magnification, and the Zoom Out (–) icon to decrease magnification. |
|
|
|
|
|


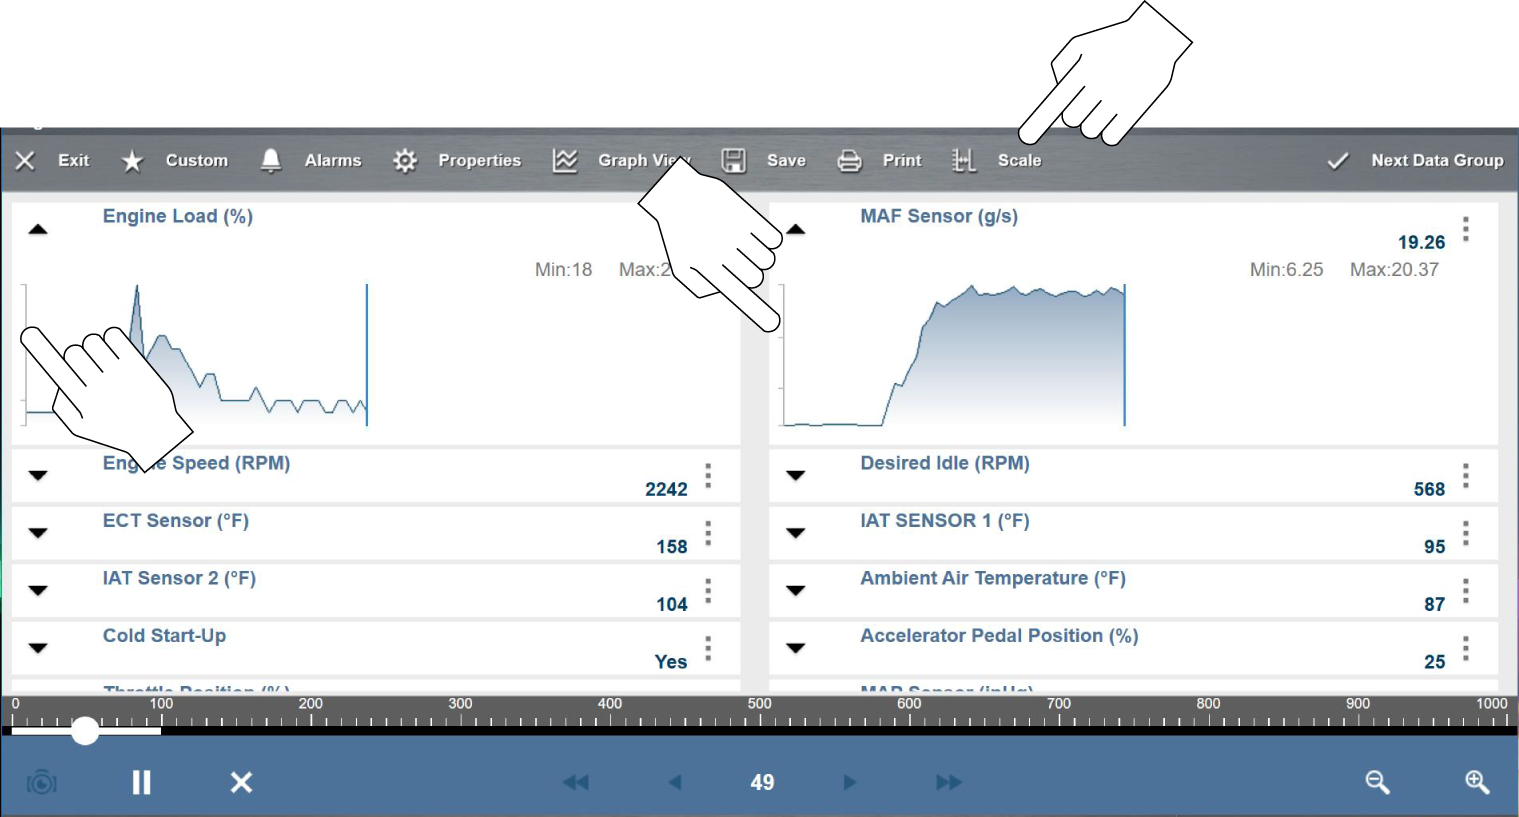
Data Menu Toolbar
The Data menu toolbar contains a number of icons that allow you to configure the displayed data (see descriptions below).
|
Icon |
Description |
|
|
Closes the current test and returns to the menu. |
|
|
Returns to the previously viewed screen. |
|
|
Configure which parameters are displayed on the screen. |
|
|
Set alarms for two-state PIDs. |
|
|
Allows you to adjust the display characteristics for all of the data screens. . |
|
|
Allows you to simultaneously view up to 16 data graphs. . |
|
|
Saves a copy of the current frame of data that can be viewed using Data Manager.. |
|
|
Opens a standard Windows Print dialog box for saving a print copy of the current frame of data. |
|
|
Hide, or display, the scale values (left side of the graph). |
|
|
Display the next data group in the Data Menu. |


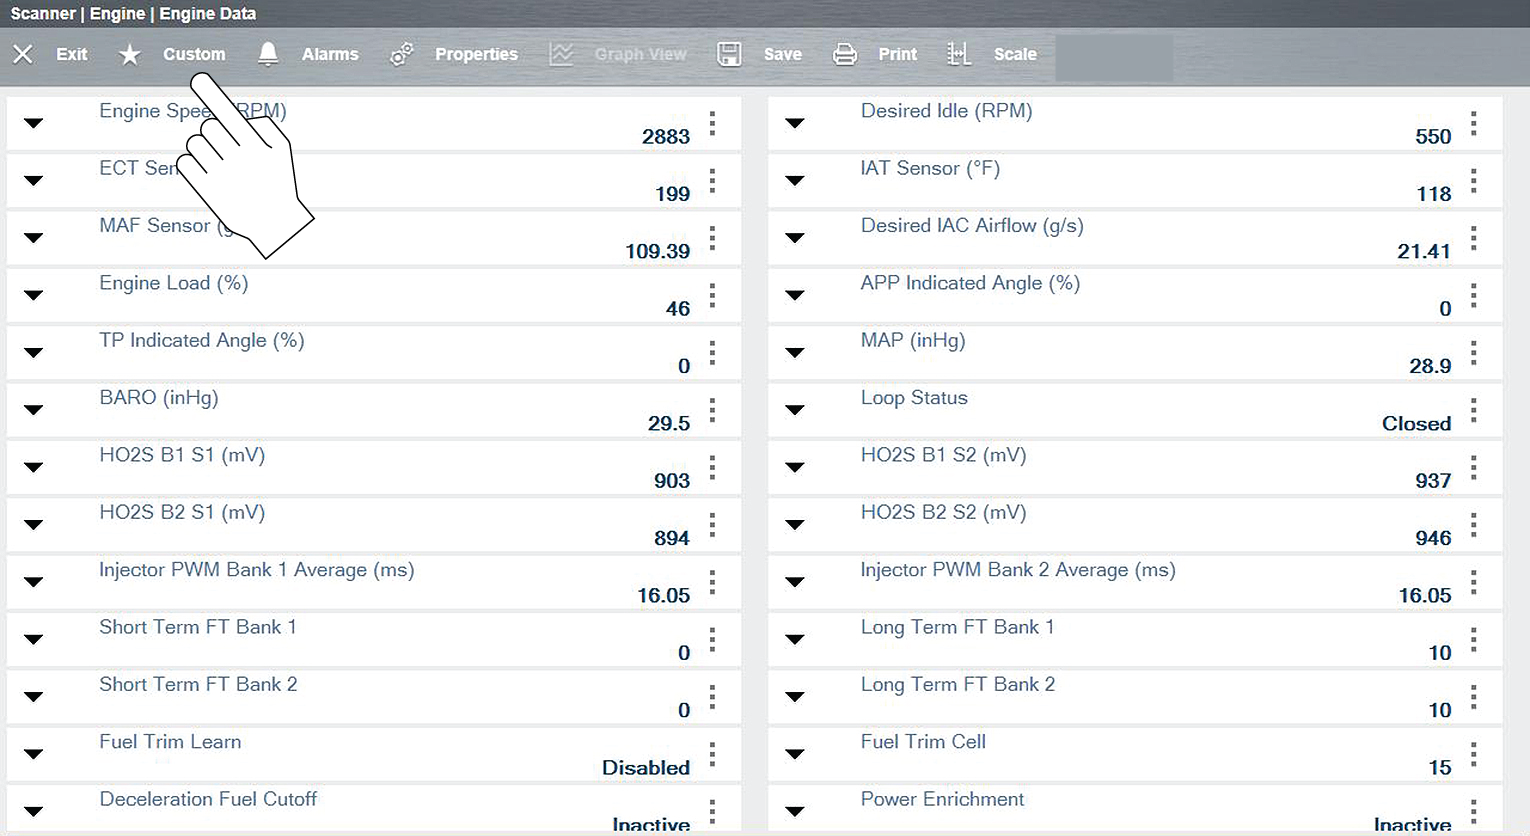
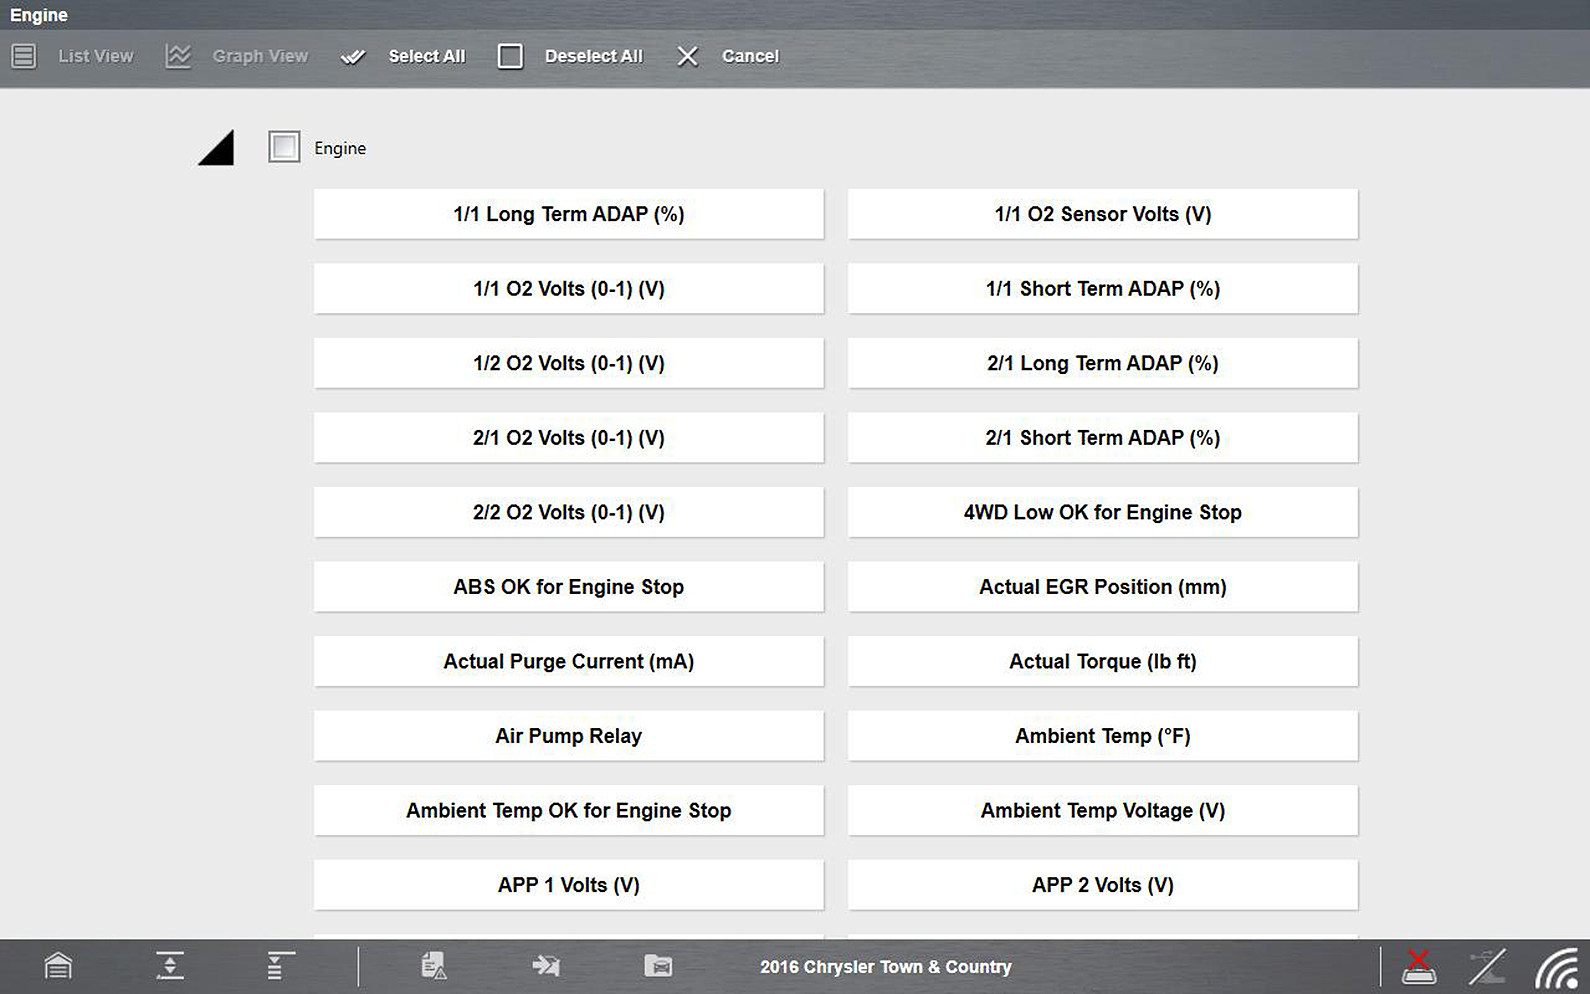
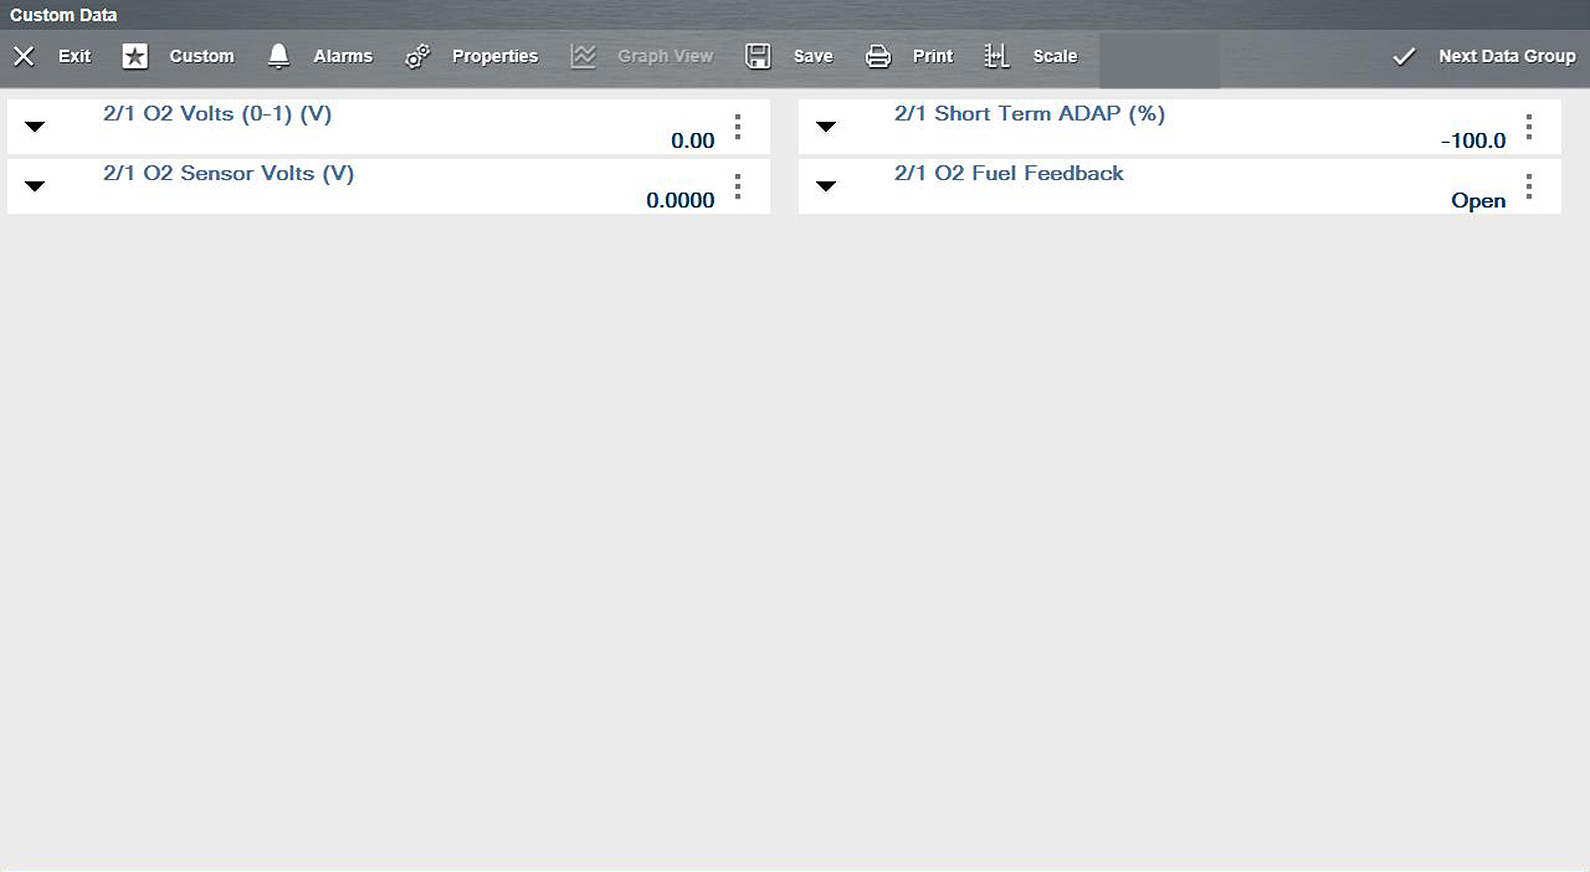
Custom is used to set which PIDs are displayed. Minimizing the number of PIDs displayed allows you to focus on specific data and may increase the data transmission rate from the vehicle. You can add or remove most parameters from the list.
Limiting the number of parameters that display allows for a faster refresh rate of the data.
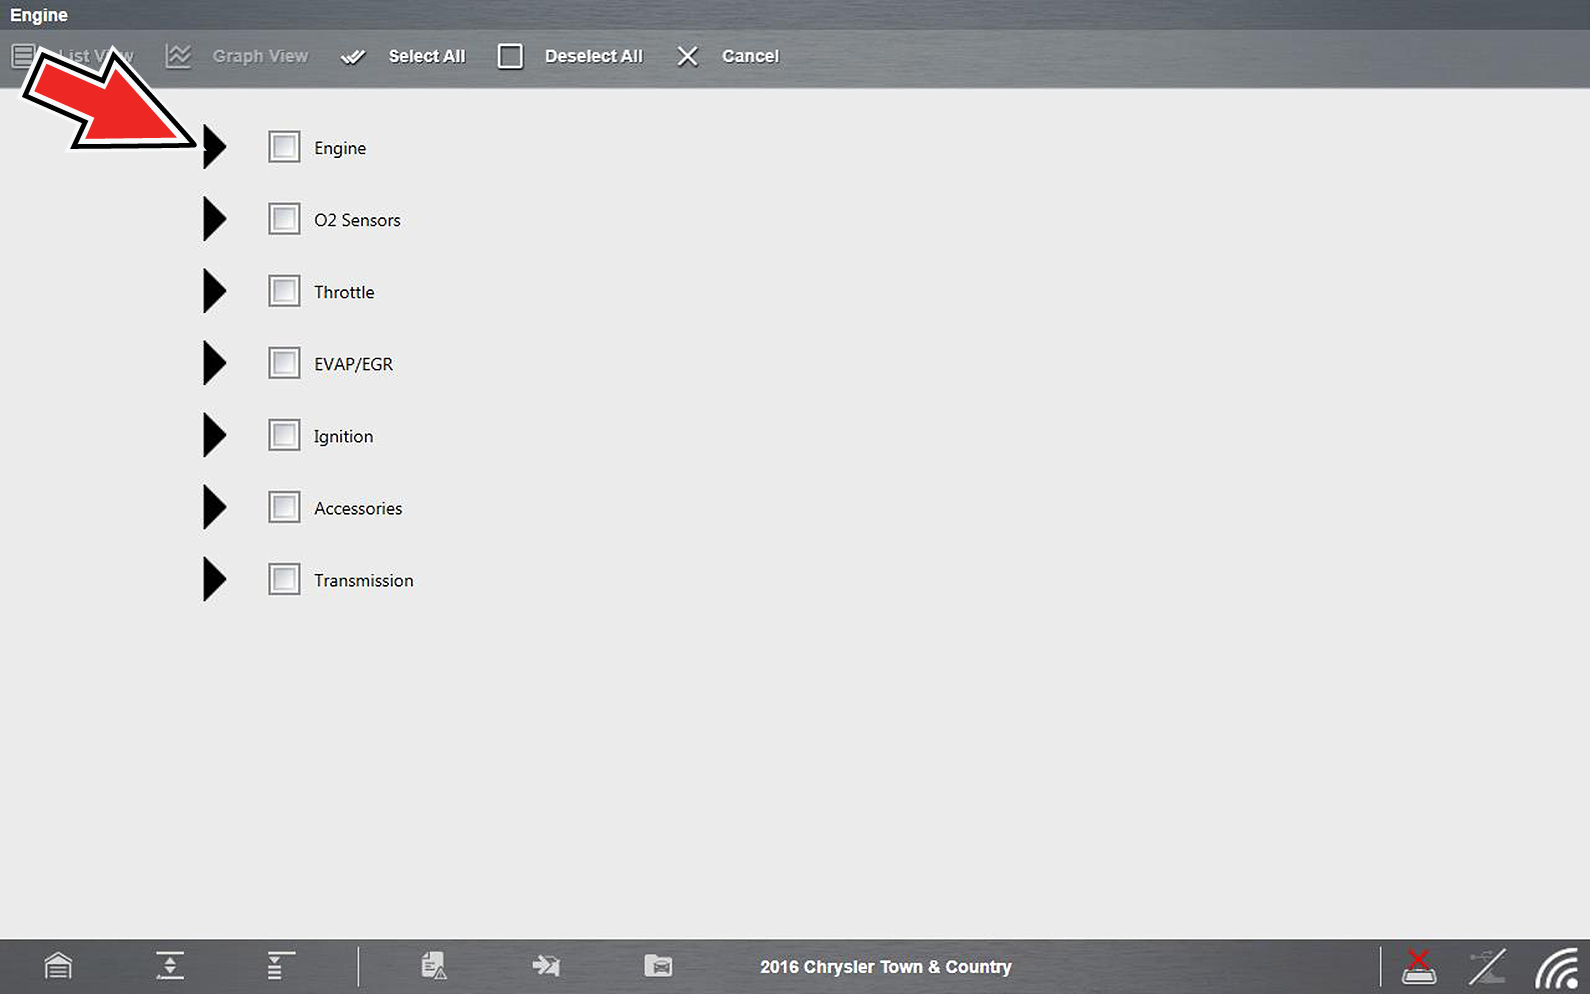
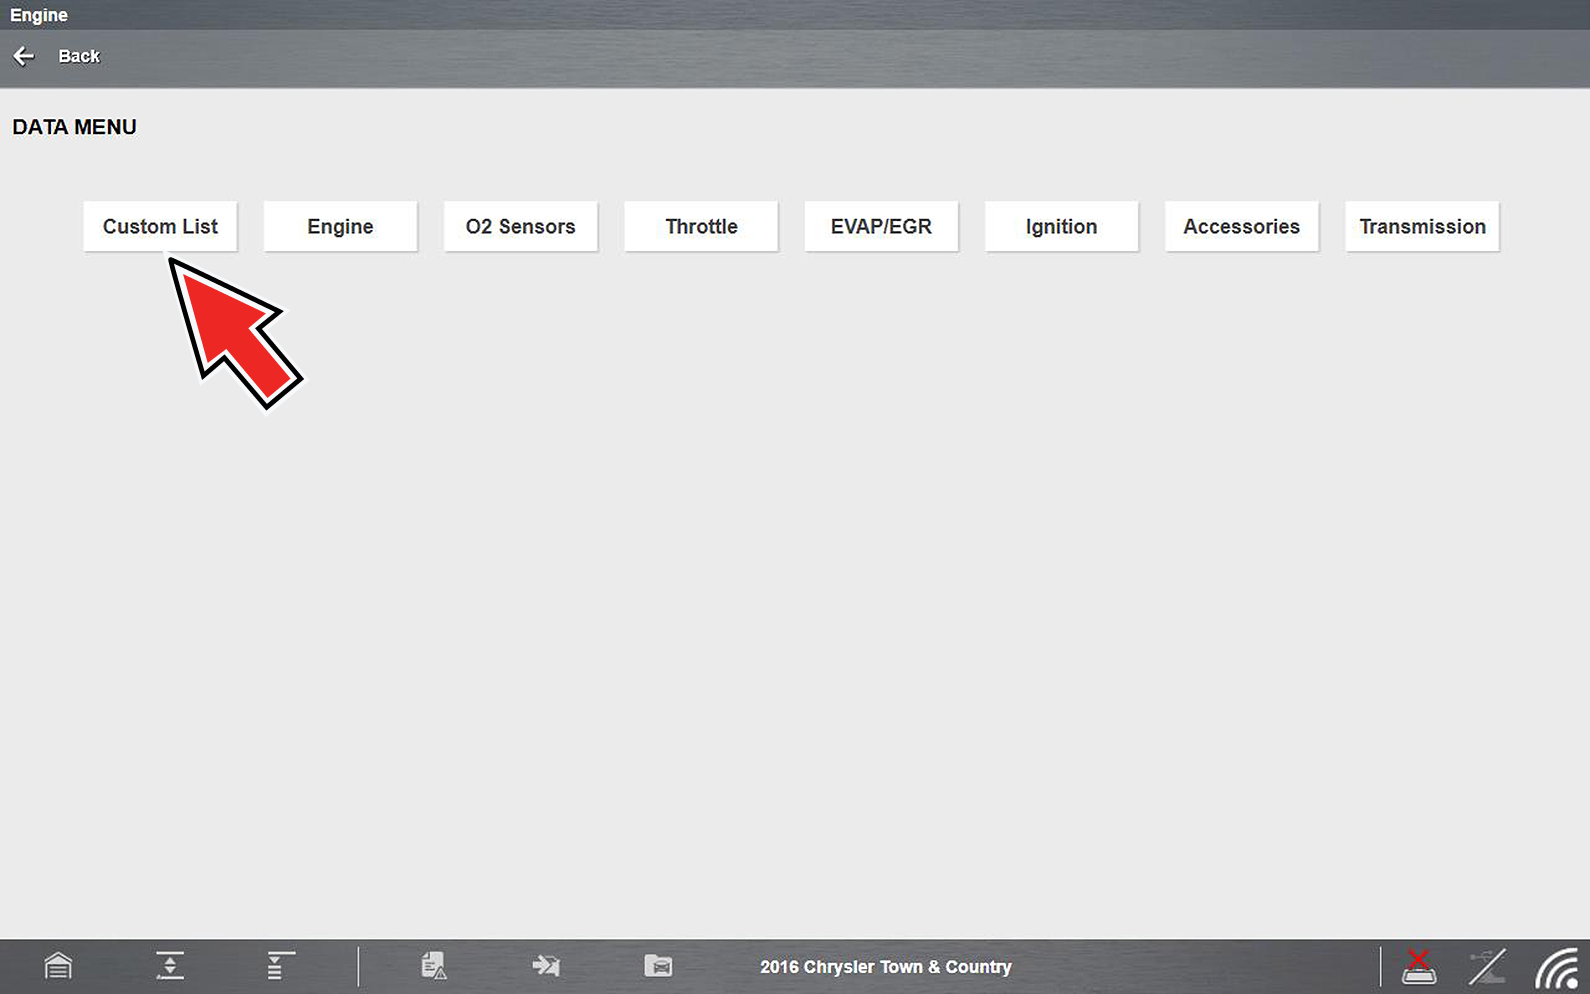
| 1. | To create a custom PID list, select Custom on the Scanner Toolbar. |
The parameter selection dialog box with all of the parameters selected opens .
| 2. | Select the Deselect All icon to clear the highlights from the screen. |
| 3. | Create a custom data list by selecting the parameters to be included. Highlighting indicates a parameter that displays, parameters that are not highlighted do not display. |
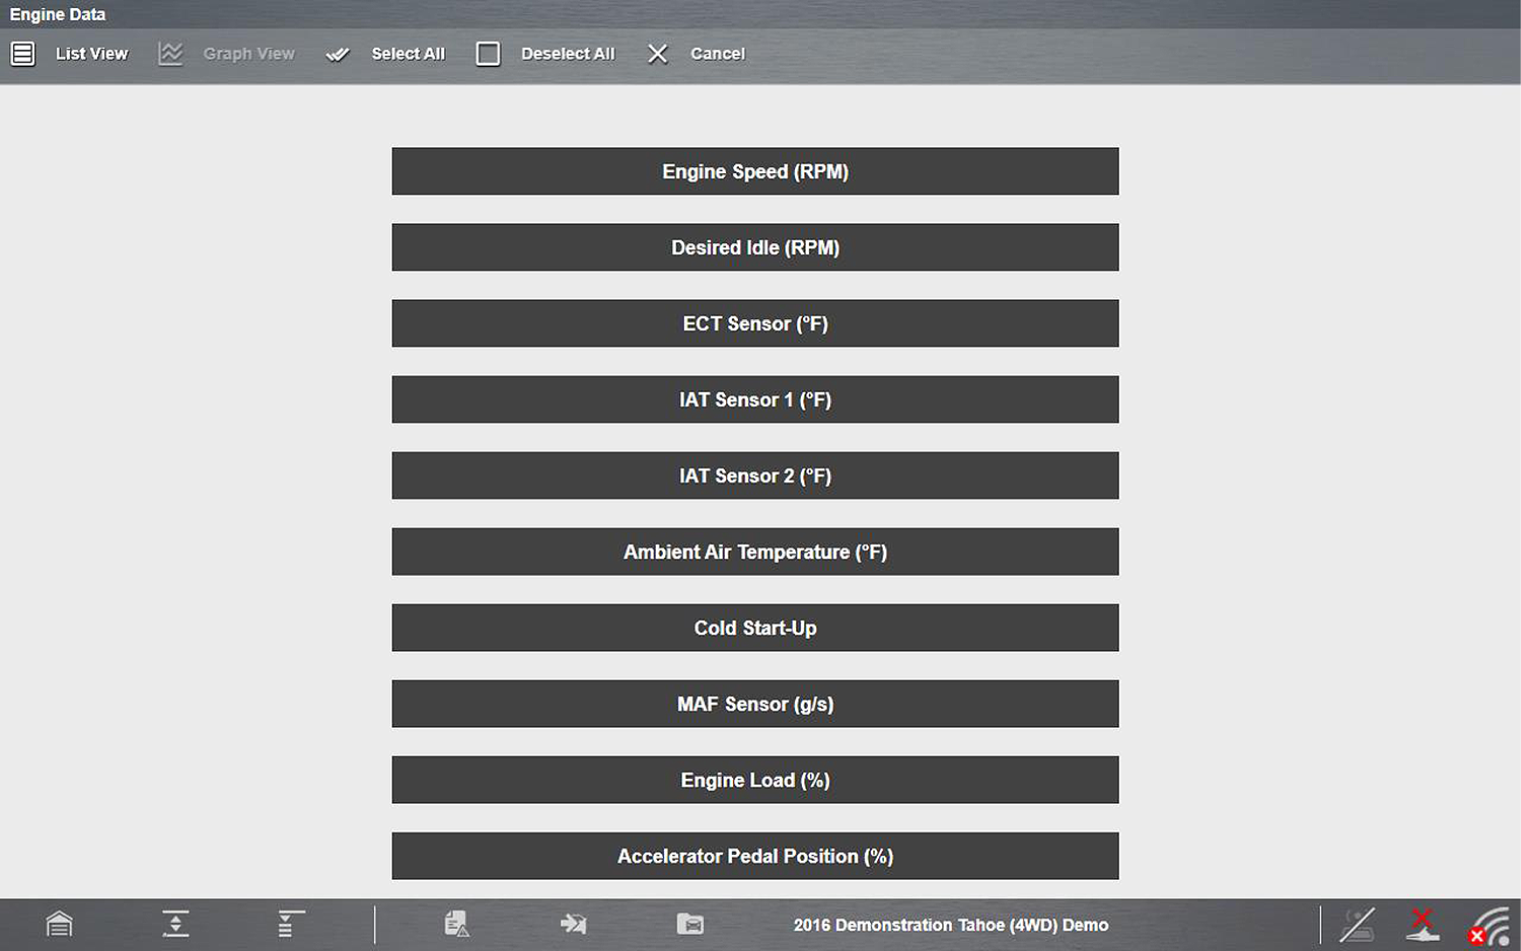
Custom configuration (Select All shown)
Keep the following in mind when configuring a custom data list:
| – | Gesture scroll if the list of parameters is longer than what is shown on the screen. |
| – | Use the Select All icon to display the complete list. |
| – | Use the Deselect All icon to remove all the currently selected parameters from the list. |
| – | Select individual parameters to highlight and include them in the list. |
| – | Select individual highlighted parameters to remove them from the list. |
| – | Use the Cancel icon to return to the data display. |
| 4. | Once all desired parameters have been selected, return to the data list: |
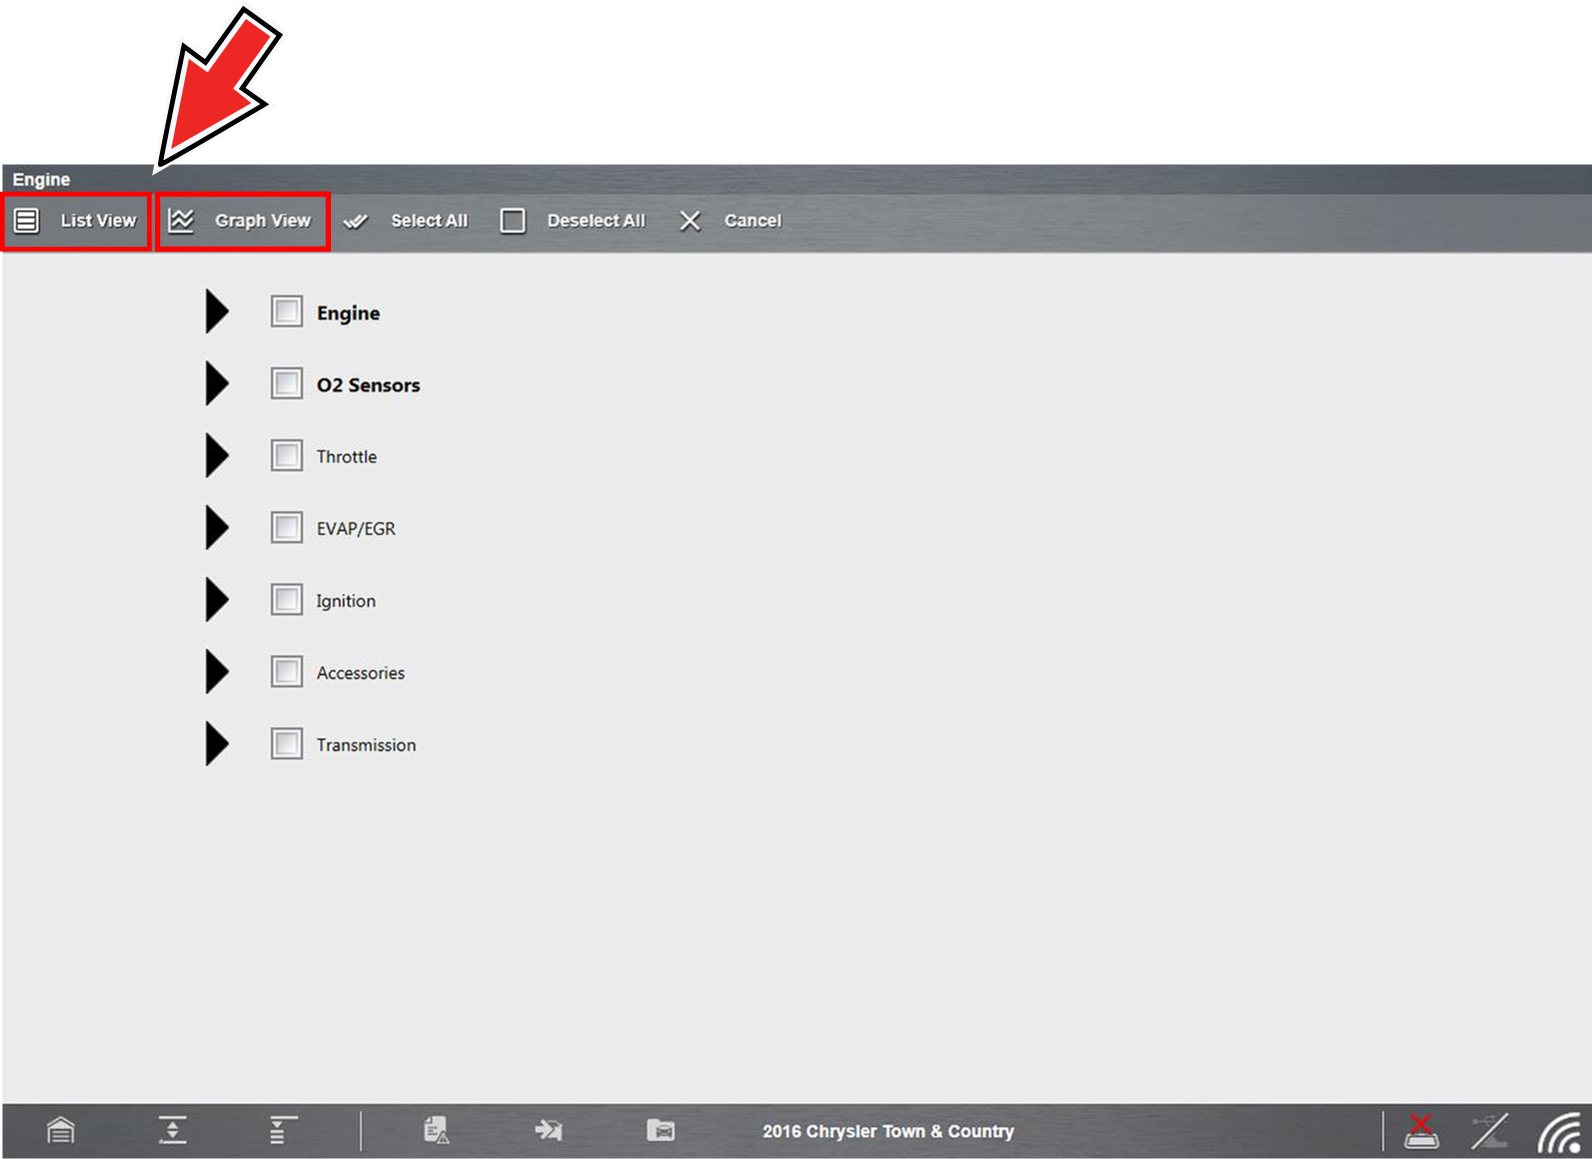
| – | Use the List View icon to return to a data screen in PID List format. |
| – | Use the Graph View icon to return to a data screen in Graph View format |
Graph View is only available when 16 or fewer parameters (the number that can display on a single screen) were selected for the custom list. Make sure that no more than 16 parameters are highlighted if the screen displays a single graph when the Graph View icon is selected.
Custom PID list (cross-system)
Some vehicles may support a cross-system custom PID list, which allows you to choose multiple PIDs from across available systems to create a custom list.
Selecting a cross-system custom PID list is similar to selecting a standard custom PID list, however you have the option to select PIDs from multiple lists. See Custom for basic operation instructions.
At the time of this publication, only select CAN integrated 2005 and later Mercedes-Benz®, Jaguar®, Chrysler®, Volkswagen® and Audi® vehicles support this feature. As future diagnostic software updates occur, additional vehicle makes and models may be included.
The total number of PIDs that can be custom selected is limited, and varies by vehicle make and model.
Limiting the number of parameters that display to those that apply to a particular situation results in a faster data refresh rate, and reduces the amount of memory used for saved files. Limiting the parameters also allows you to focus on any suspicious or symptom‑specific data parameters.
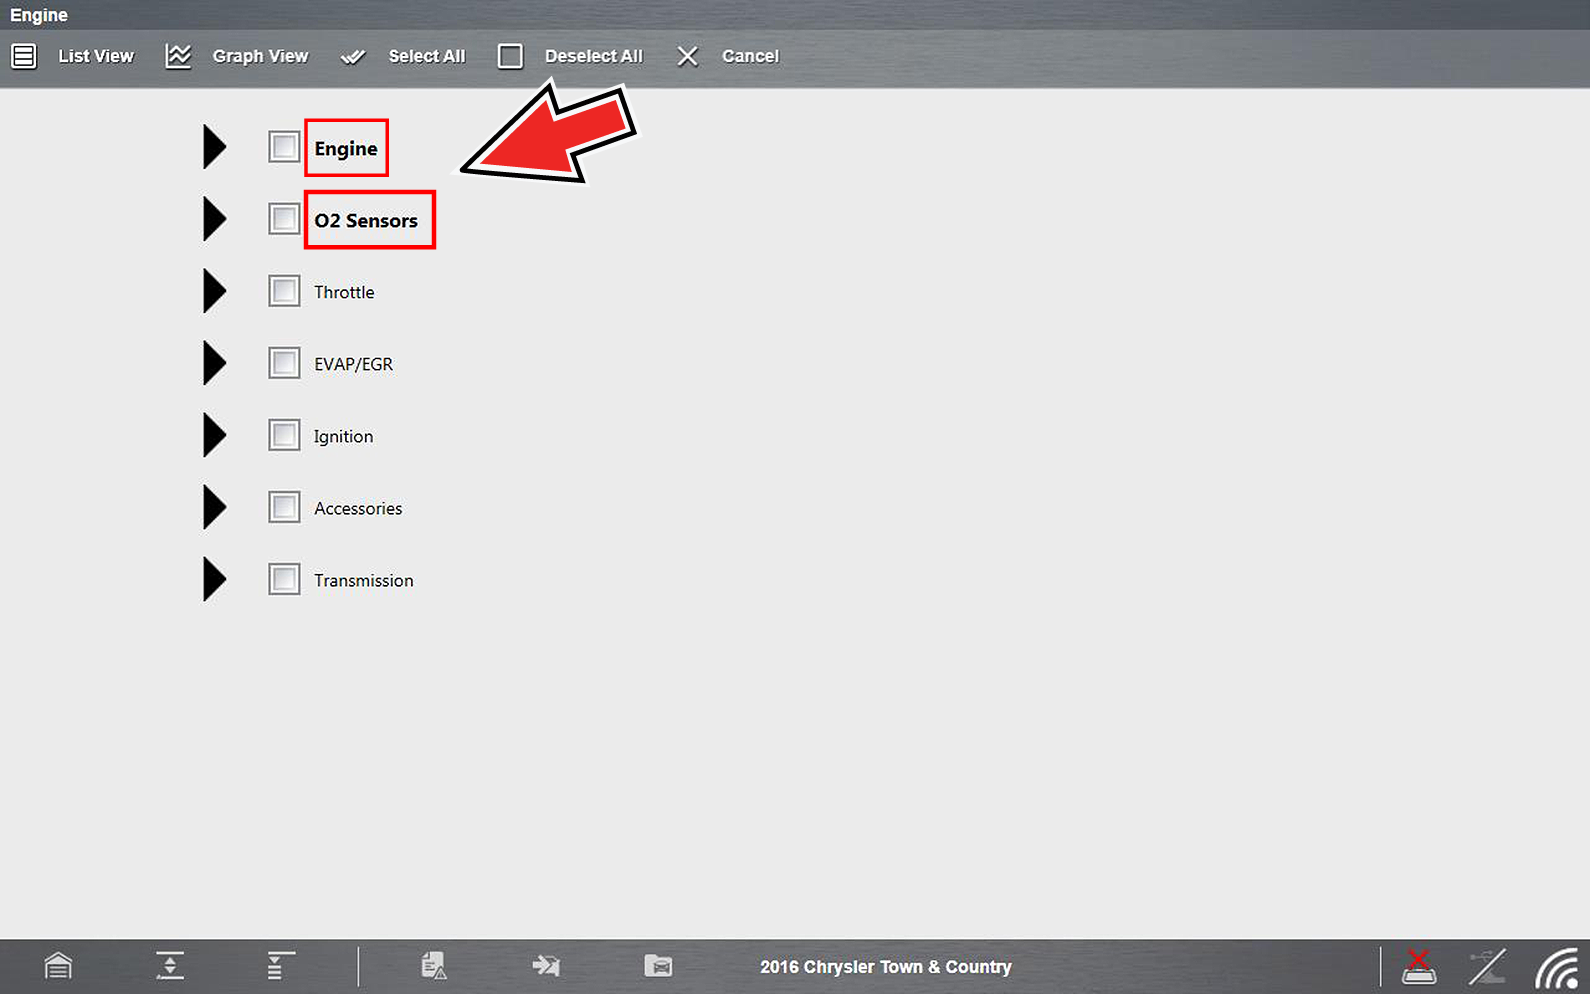
| 1. | To create a cross-system custom PID list, from the Data screen select Custom from the toolbar. |
The custom data selection screen displays (upper image).
| 2. | Select the |
Each PID will highlight, as you select it.
Once you have selected all the PIDs you want to build your custom list, those PID categories that have selections will be highlighted in the main list.
To choose all the PIDs in a category, select the PID category check box.
| 3. | To view the custom list, select List View or Graph View from the toolbar . |
The custom list displays.
From the Custom Data list, if you select Back to display the Data Menu list, your new Custom List shows as a selectable option at the top of the list. This Custom List option will only remain an option as long as you are in the Data Menu. This allows you to view other data lists and return to your Custom List, however, if you back out to the Main Menu, and then return to the Data Menu your Custom List is deleted.
Alarms are visual indicators alongside a parameter in the data display list that change color to show the signal status. A green alarm indicates on, a gray alarm indicates off. Only digital parameters, those with a range limited to two states (e.g. enabled/disabled, on/off, etc), can have alarms. Parameters with continuous ranges, such as variable voltage and pressure values, cannot have alarms. The alarm indicator assignments remain as selected until you exit the data list:
To configure alarm settings:
| 1. | Select the Alarms icon on the Scanner Toolbar. |
The Alarm List dialog box will open.
| 2. | Check the parameters that you want to show alarms. |
| 3. | Select Save. |
Alarm indicators now appear next to the selected parameters in the Data List.

Alarms can only be set for certain parameters. If the Alarm List dialog box is empty, no parameters are available and alarms cannot be set.
Properties is used to configure (all) graph color, settings, samples after trigger, and sweep .

Show Grid is used to hide/display graph background grid pattern.
Samples After Trigger settings determine how many data samples (number of frames) are recorded following a trigger event.
Sweep is use to set the amount of data that displays across the graph. Values are in sample points (frames of data). A frame of data equals one complete transmission of the serial data by the electronic control module.
Graph View allows you to display up to 16 graphs . To view more than one PID in a multi-graph display, select the PID Expand/Collapse icon to open each PID in graph display you want to include, then select Graph View from the toolbar. To return to list view, select List View from the toolbar. The display defaults to a single graph if more than 16 graphs are open when the toolbar icon is selected. Should this happen, return to the data list and close some of the graphs.
The screen does not scroll in Graph View mode, it adjusts to show only the selected parameters.
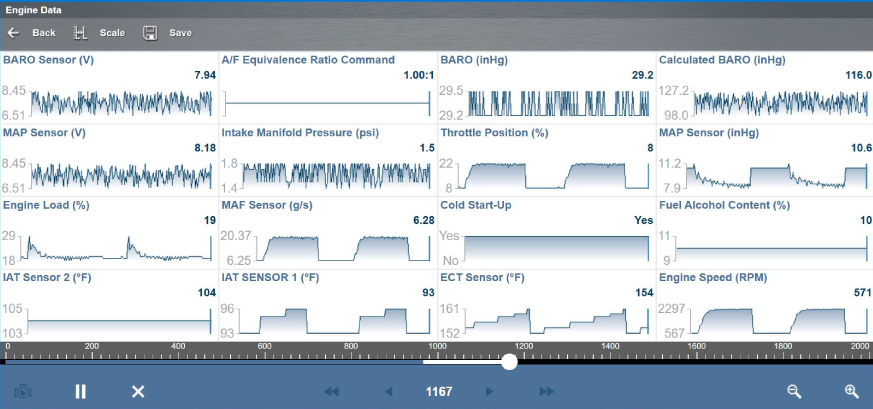
Graph View mode can also be used from the custom data list configuration screen. Refer to Custom for details.
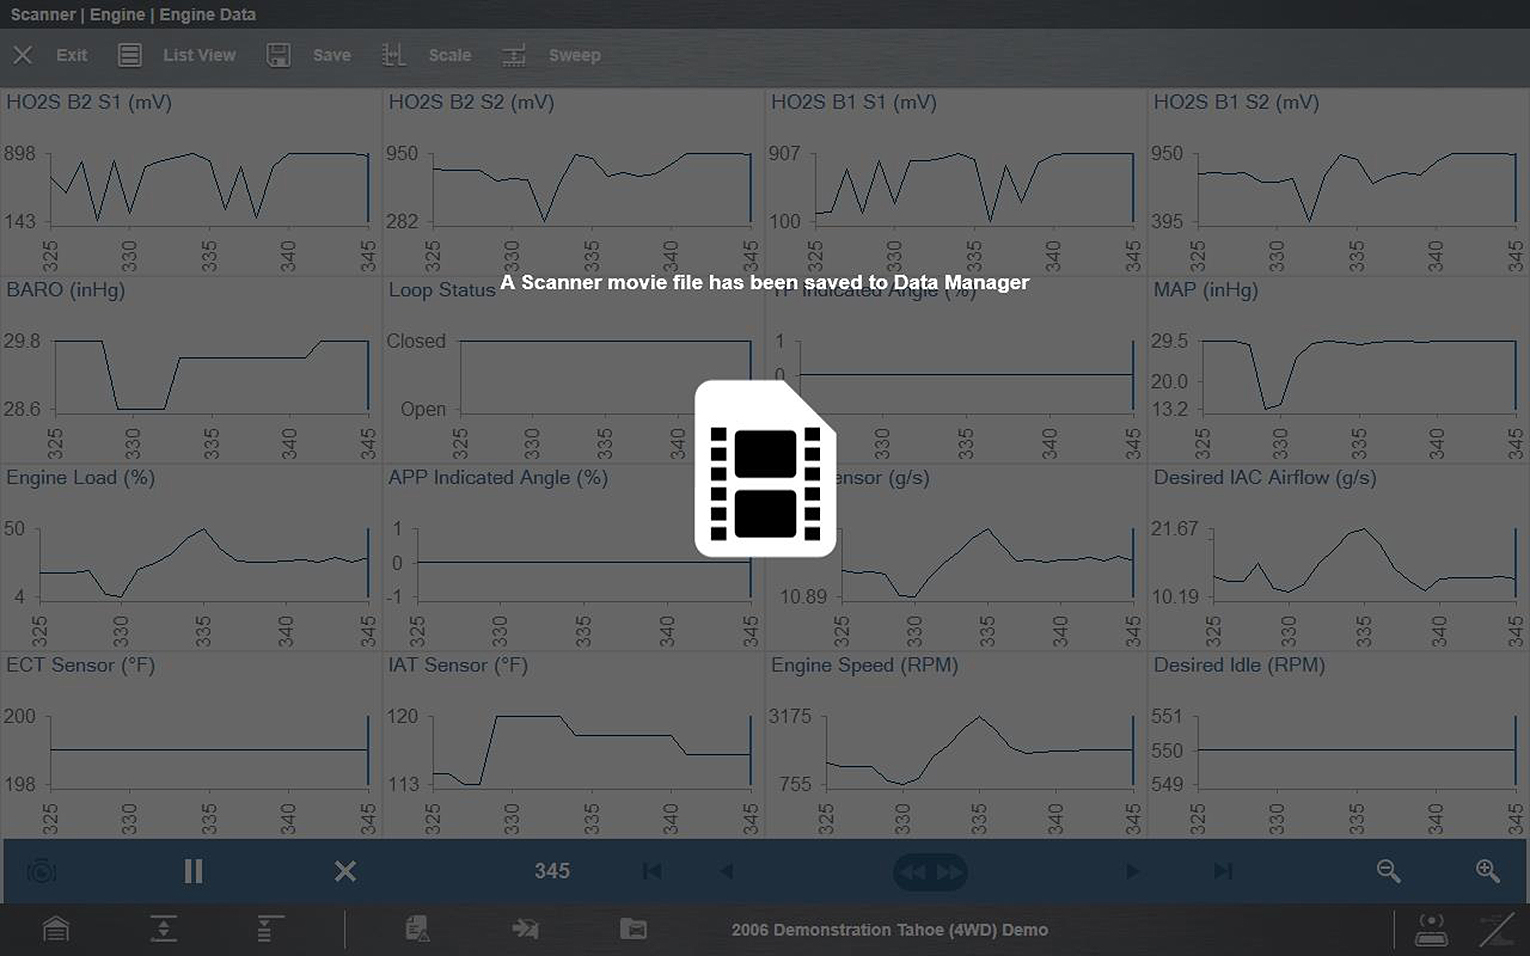
Save is used to record PID data. Saved files can be helpful when trying to isolate an intermittent problem or to verify a repair during a road test.
To save PID data:
| ● | Select Save. |
A save dialog box displays while data is being saved. The file is saved when the message box disappears.
Save file screen
To open saved Scanner data files, from the Home screen select Data Manager >Scanner Data Folder, see Scanner DataViewer.
The diagnostic tool has the capability to collect, store and save PID data utilizing internal buffer storage memory.
As data is displayed onscreen, it is also automatically stored in buffer memory. The data buffer runs continuously (storing data) until the Pause, Clear, or Save icon is selected. All PIDs in the list are stored, not just those displayed.
Buffer memory is limited to a predetermined “total” size. When buffer memory reaches it’s full capacity, the data buffer will continue to store new data, however previously stored data is deleted to allow room for the new data being stored.
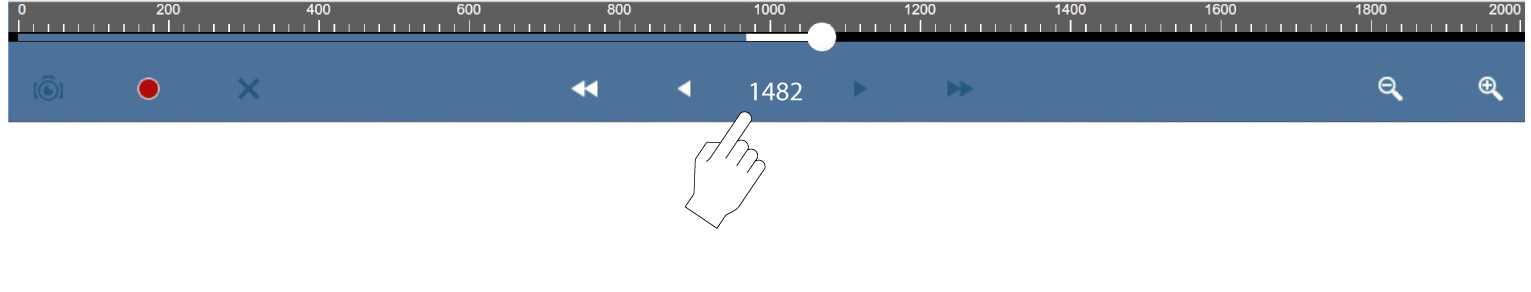
The most recent data is always available for review when Pause is pressed, and can be reviewed using the toolbar controls.
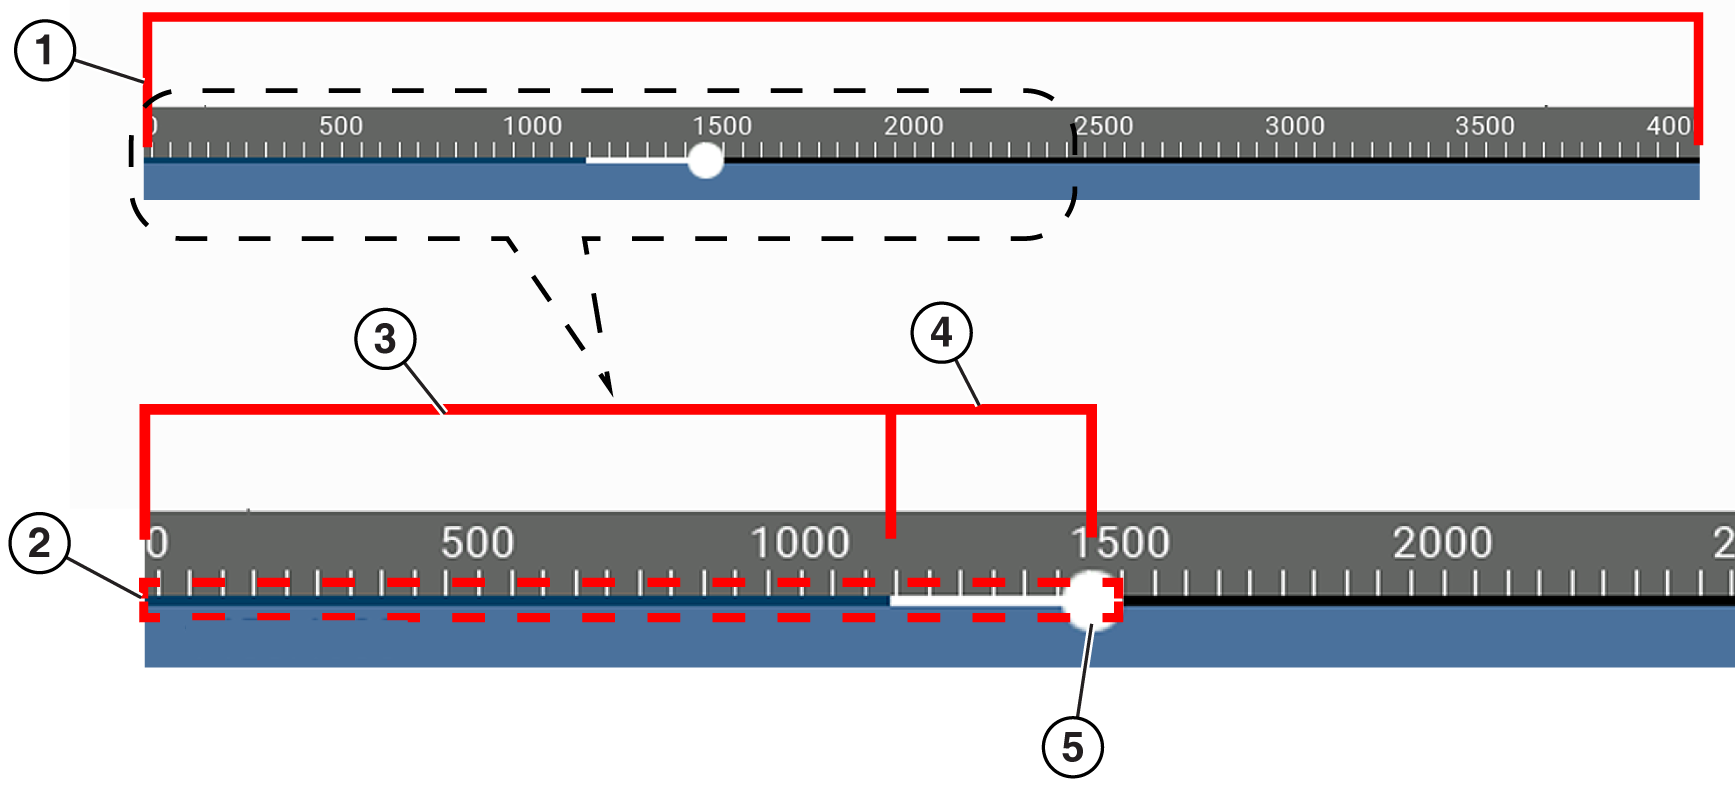
| 1. | Data Buffer Scale - Displays maximum data buffer size (e.g. 4000) across screen |
| 2. | Data Buffer Indicator - Bar graph indicates total data stored in the memory buffer. Includes blue and white graph bars and active position indicator. |
| 3. | Blue Graph Bar - Stored data not displayed onscreen |
| 4. | White Graph Bar - Stored data displayed onscreen |
| 5. | Active Data Position Indicator - Round icon indicates active (current) position in the data, which is also denoted by the Active Data Position Counter in the Data Controls Toolbar below it. |
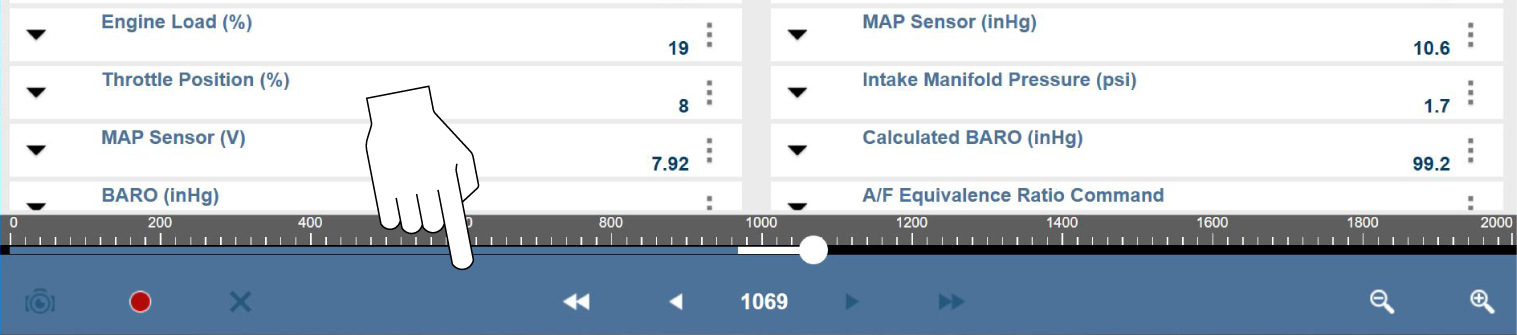
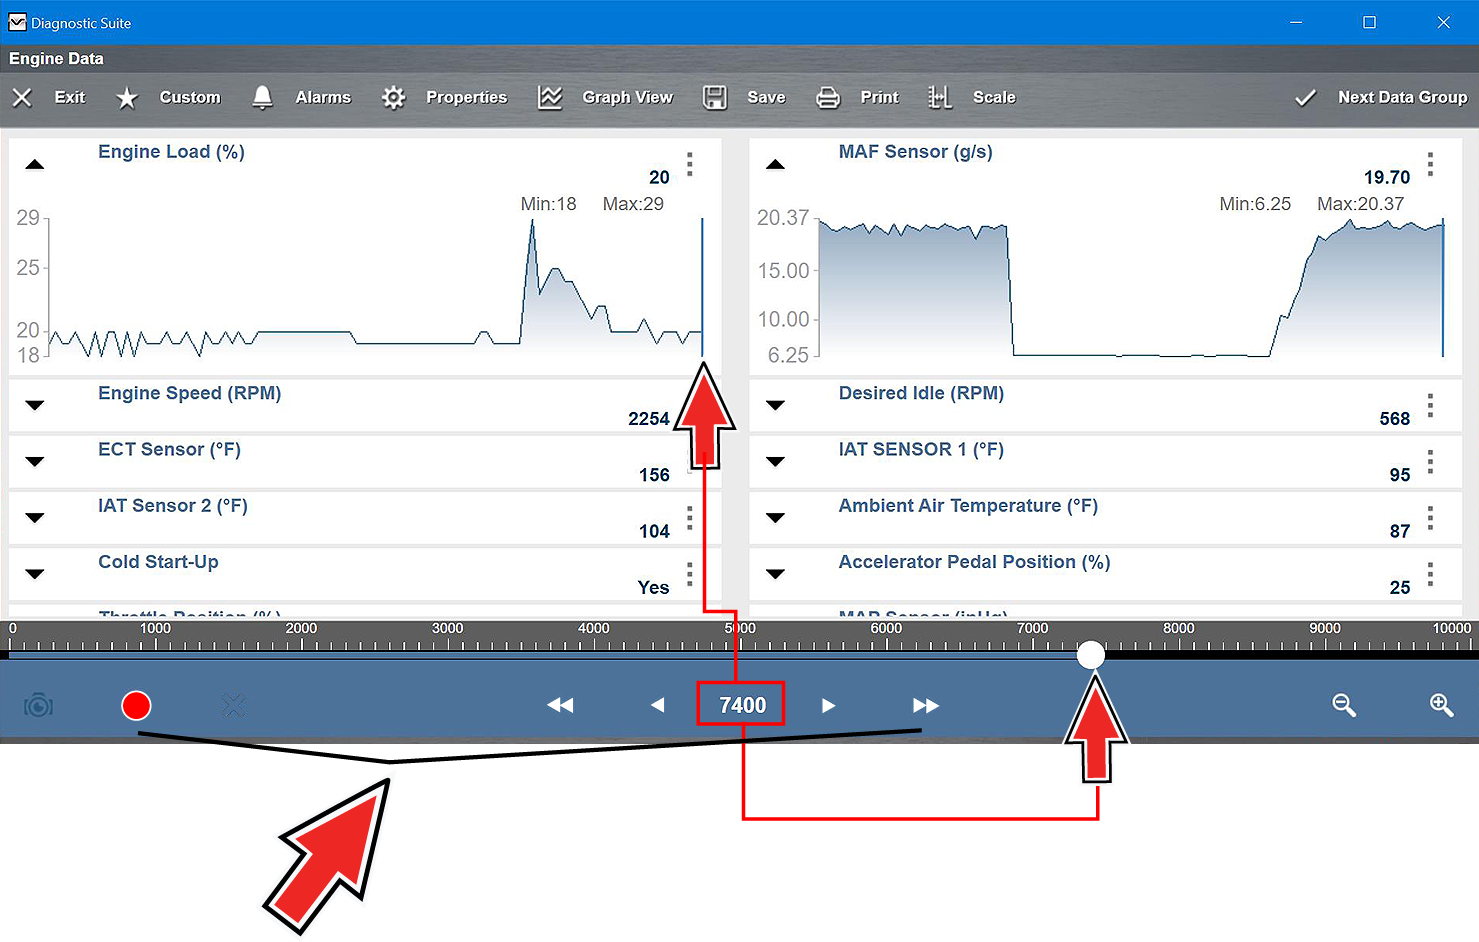
Vertical cursors are automatically displayed (in graphical PID views) to mark specific data reference points.
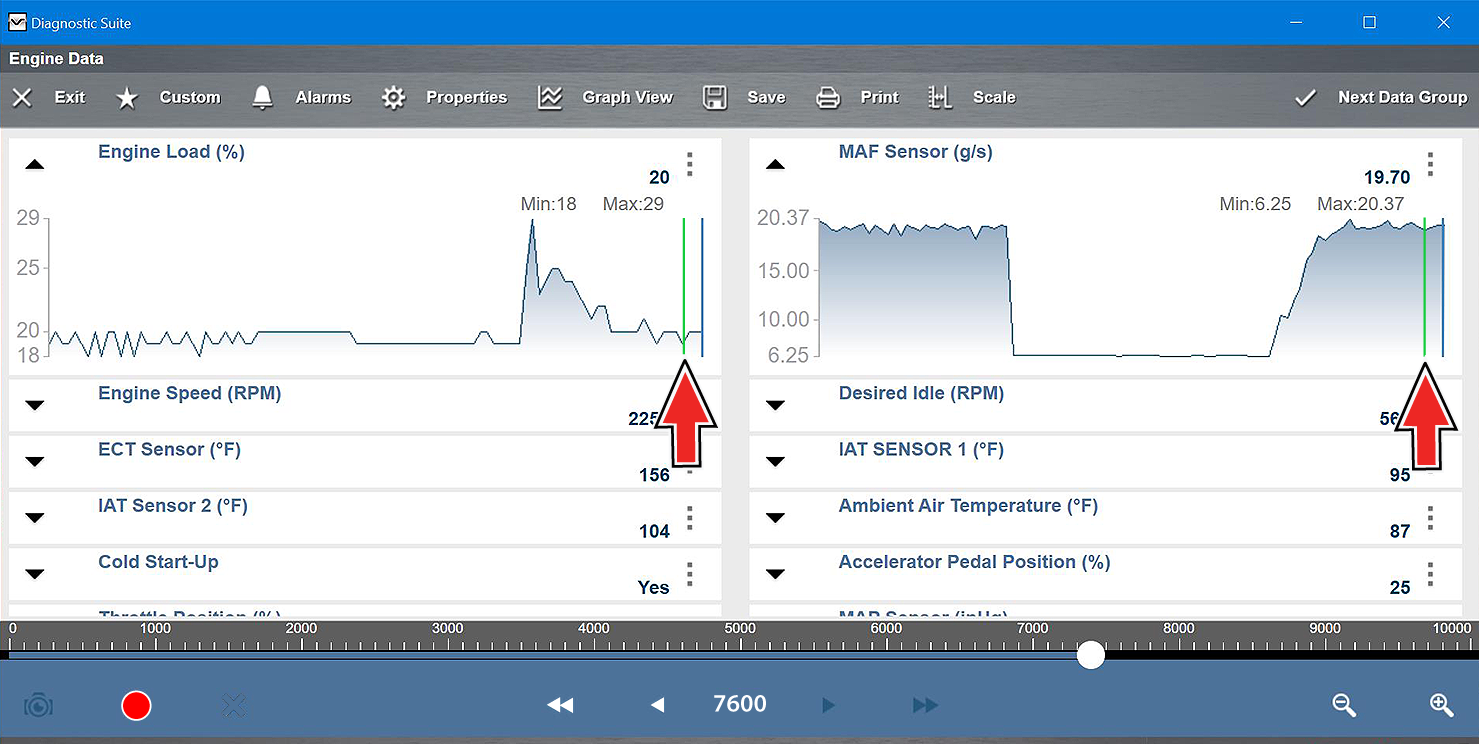
Green (Pause) - If you select Pause while collecting data, a vertical green cursor is automatically placed at that point in the data to indicate where the data was paused or saved.
| ● | Each time Pause is pressed an additional cursor is added, and appears when Start is pressed to resume data collection. |
| ● | Cursors are displayed in all PIDs as reference markers. |
| ● | Cursors are retained and appear in saved data files. |
Blue (Current Position) - As data is displayed, a vertical blue cursor is shown as an indicator to the current position in the data. This position is denoted by the current position value in the counter display.
| ● | Cursors are displayed in all PIDs as reference markers. |
| ● | Depending on the amount of data saved, the blue cursor may be located on the far right making it difficult to see. If this happens, (during playback) use the control icons (Step/Skip) to move the data until you can see the cursor. |
Solid Red (Triggered PID Activation Point) - When using triggers, a vertical solid red cursor is displayed in the data of the triggered PID at the point where the trigger was activated.
| ● | When multiple PIDs are armed, only the PID that is triggered first will display a solid red cursor. |
Dashed Red (Trigger Activation Reference Point) - When using triggers, dashed red vertical cursors are displayed in all PIDs (except the PID that was triggered) as reference to the triggered PID activation point.
| ● | When a trigger is activated the displayed solid red and dashed red cursors are all vertically aligned in the graphed data to show the relationship of the trigger point in all PIDs |
During normal operation, data from the vehicle is continuously being stored in buffer memory as it is displayed onscreen. The Pause icon, allows you to temporarily pause data collection to review it in detail.
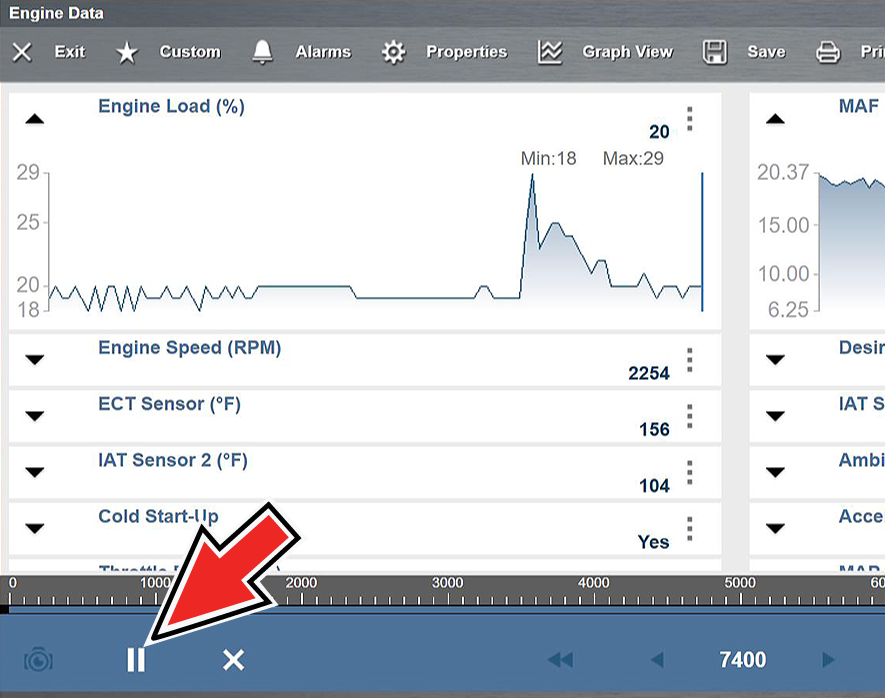
After Pause is pressed:
| ● | Use the review control icons to accurately move through the data. |
| ● | The blue (vertical cursor)indicates your position in the data and is denoted by the current position value in the counter display. This cursor displays in all PIDs. |
To resume data collection (after pausing), select the Start icon.
| ● | The screen changes back to display data. |
| ● | A vertical green cursor is displayed on all PIDs, indicating where the data was paused. If Pause is pressed multiple times, green cursors will be shown at each instance. |
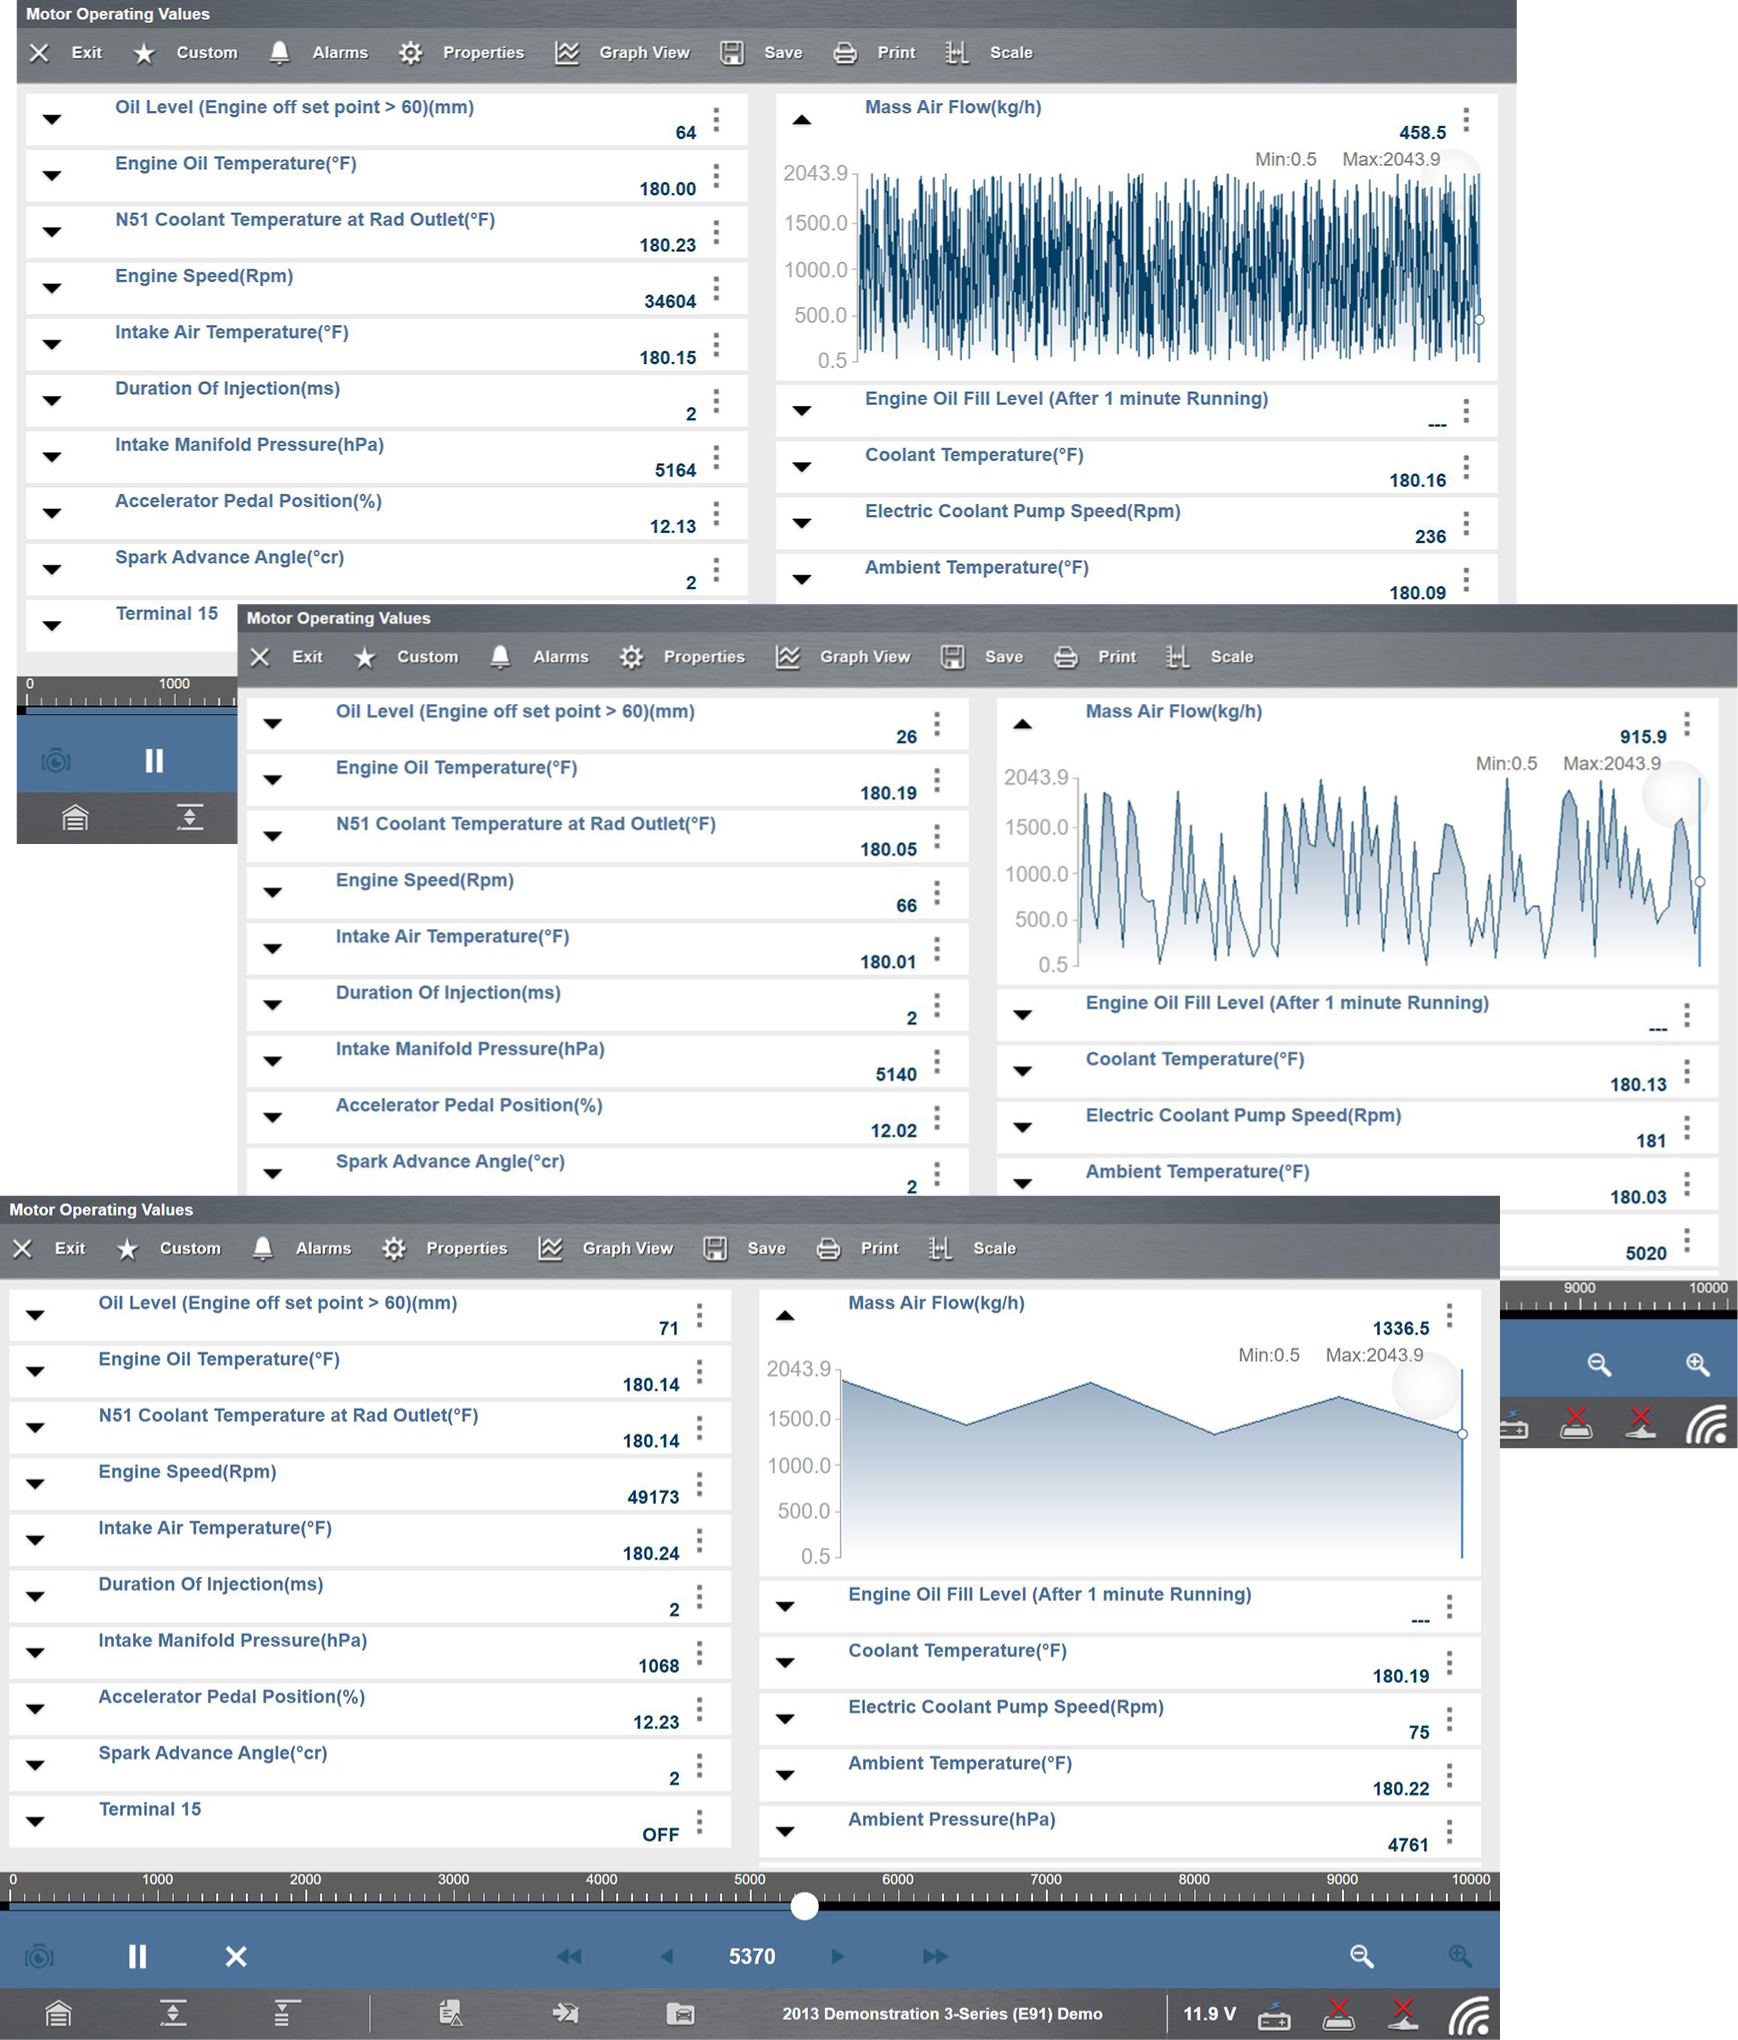
The zoom function allows you to change the magnification level of the graphed data during data collection and review. Changing magnification levels allows you to compress or expand the displayed data to quickly find glitches, or signal losses.
Use each icon respectively to Zoom In and Out to change the magnification level. Screenshots shown represent zoom level examples from full zoom out to full zoom in.
|
Zoom In/Out |
Increases/decreases the magnification by decreasing the sweep of the graph. The zoom options on the Data Buffer toolbar allow you to change the magnification level of the sweep when viewing data graphs. Use the Zoom In (+) icon to increase magnification, and the Zoom Out (–) icon to decrease magnification. |
|
|
|
|
|