For control icon descriptions, see Scope Multimeter Control Icons.
The zoom function is only available in Review Mode, and can be an invaluable tool when searching for events of interest within captured data. Zoom effectively gives you the ability to change the magnification level of the signal sweep during data review.
As zoom, allows you to change the magnification level of the signal sweep, this allows you to compress or expand multiple screens of data to quickly find glitches, or signal losses.
Control icon function is normal when using zoom, with the following exception:
Forward 1 Frame / Back 1 Frame control icons - (press once) moves multiple frames relative to the set magnification level (e.g. 2X setting, moves 2 frames; 16X setting, moves 16 frames).
When the Zoom icon  is selected the display defaults to the "Max" magnification level and a dropdown scroll menu will display .
The dropdown menu allows you to select the display magnification level from a range of 1X to 256X (Max). The "Max" (maximum) option displays all data captured on one screen.
It is important to remember that whatever sweep setting you used during data capture is what the 1X zoom level will show.
The active zoom options (1X to 256X (Max)) that are selectable are dependent on the amount of data stored in the buffer. Less data captured = less zoom options. More data captured = more zoom options.
As there is a direct relationship between the length of time the data is captured in, and the resultant level of detail you will have when reviewing it, review the information in Capturing / Using Data for tips on capturing and reviewing data.
When zoom levels of 2X and higher are selected, a Zoom cursor (vertical dashed line) displays onscreen. The cursor is used to quickly mark and navigate to points of interest or glitch in a captured waveform.
The Zoom cursor can be used to mark the approximate position of a glitch and can be manually dragged onscreen to the desired position. The new cursor position will be centered on the screen when a lower magnification level is selected.
The figure below shows an example at Max with the Zoom cursor positioned in the area of a signal drop glitch.
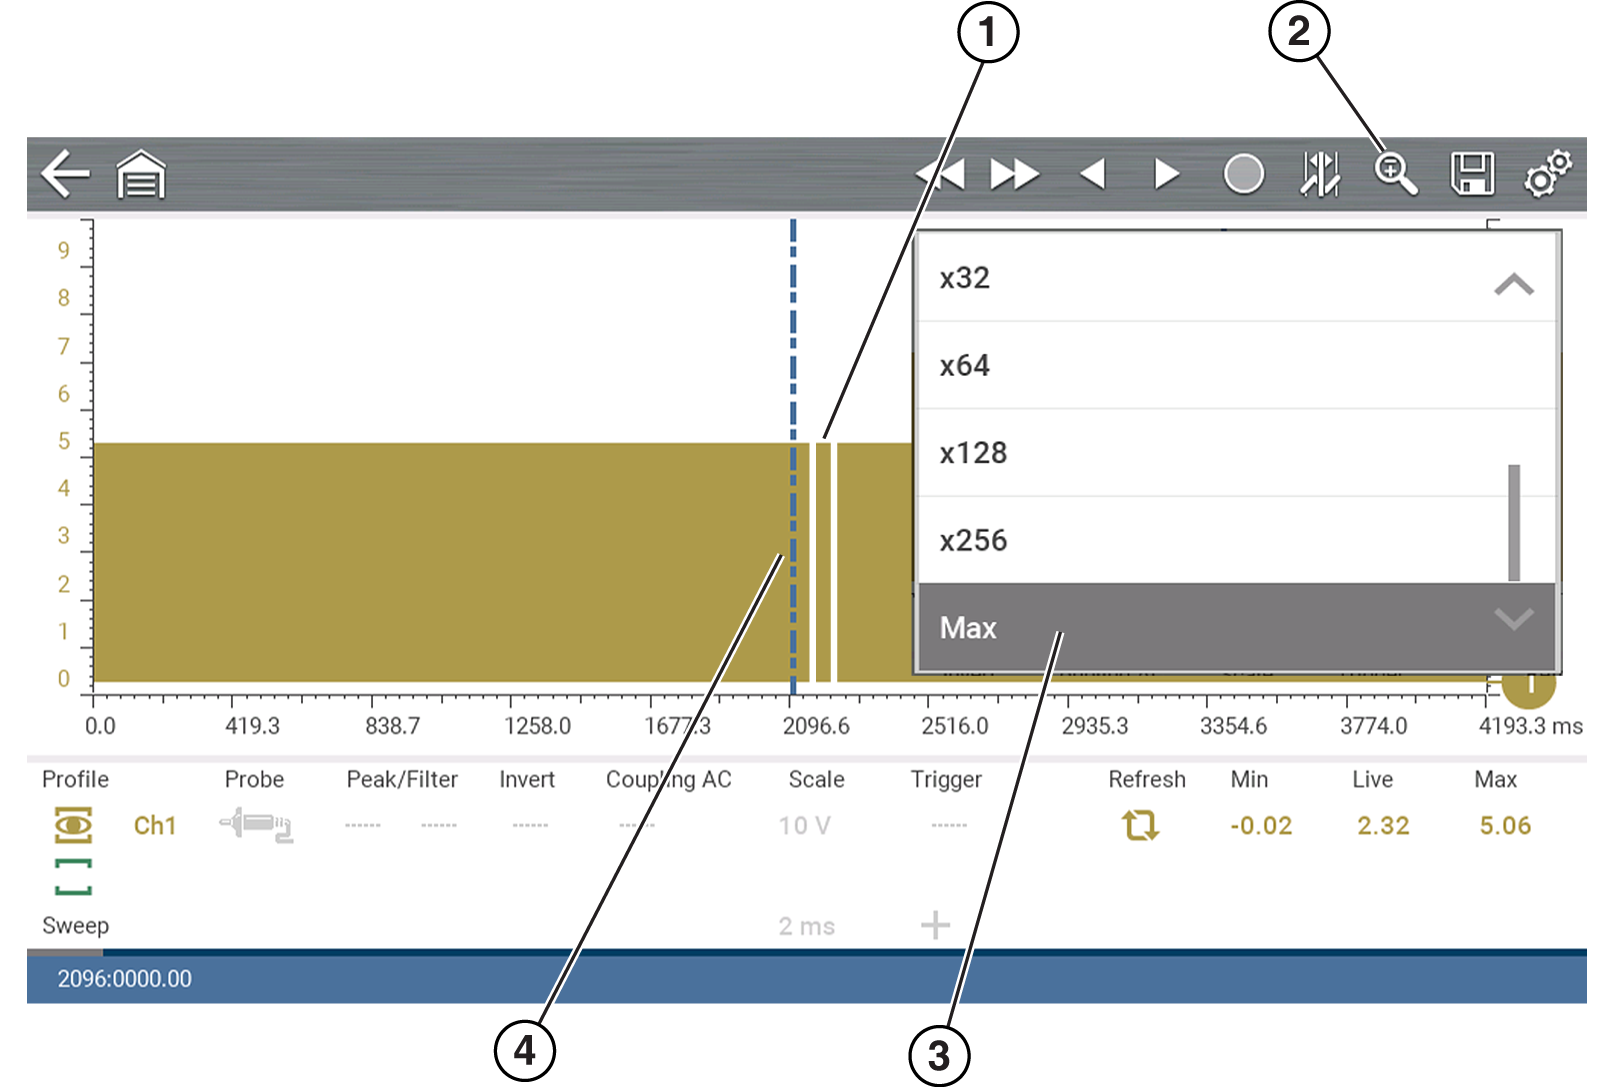
| 1. | Glitch |
| 2. | Zoom Icon |
| 3. | Zoom Magnification Level (Max shown) |
| 4. | Zoom Cursor |
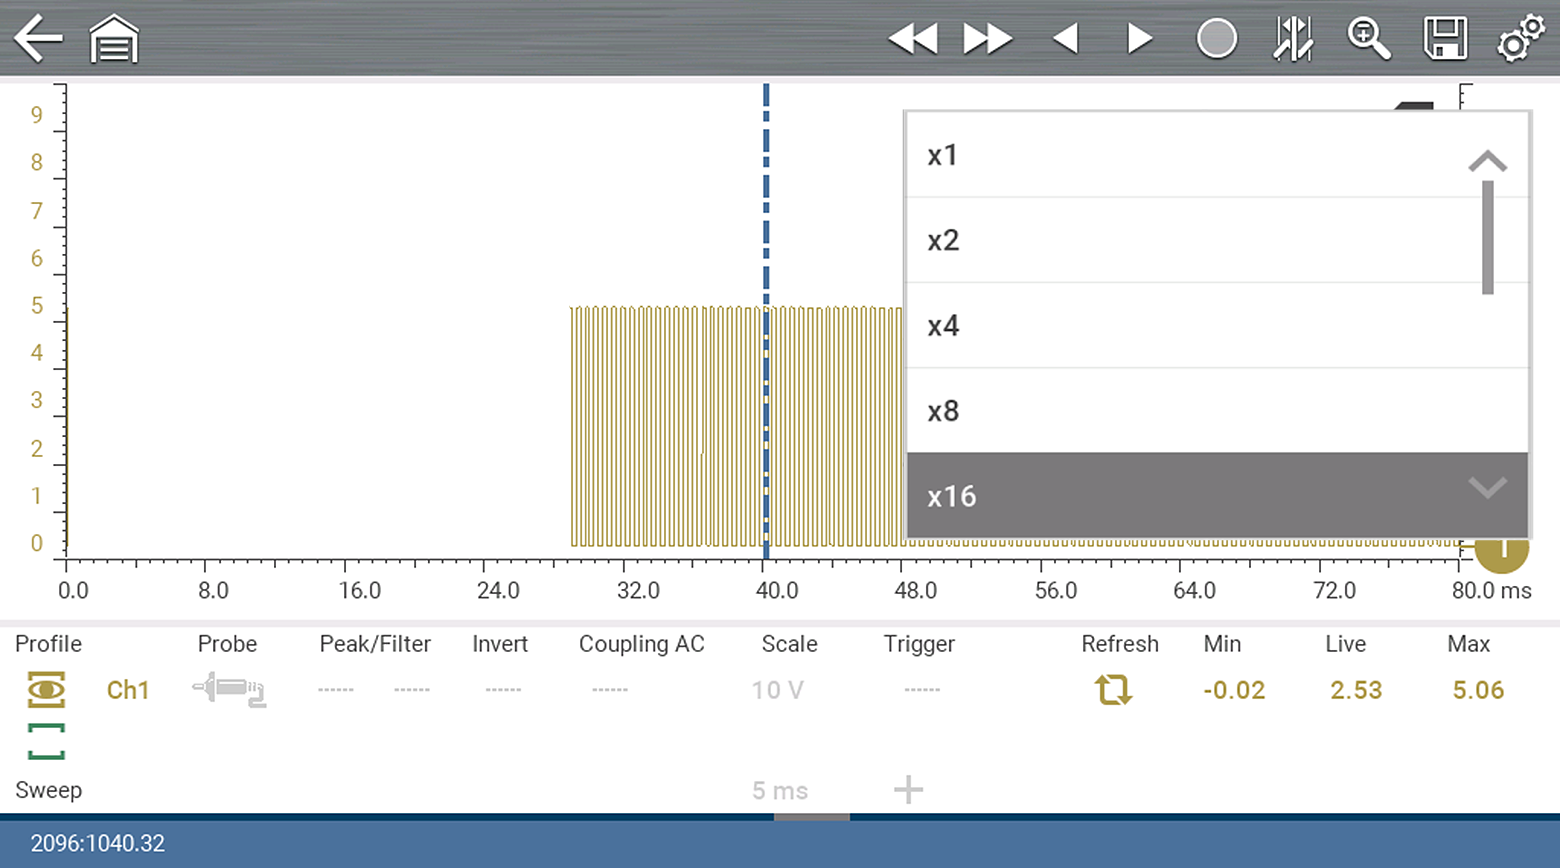
To quickly identify a glitch in a pattern, it may be easier to initially view the waveform at a higher magnification level (e.g. 256X or "Max") to display the entire captured waveform, find the area of interest and then lower the zoom level to 8X or 2X to review that area in detail. See the following figures and the Zoom Example below.
The upper figure shows an example at 16X of the same waveform shown in the lower figure. In the upper figure at 16X, the glitch is easily seen as compared to higher magnification levels.
Zoom Example
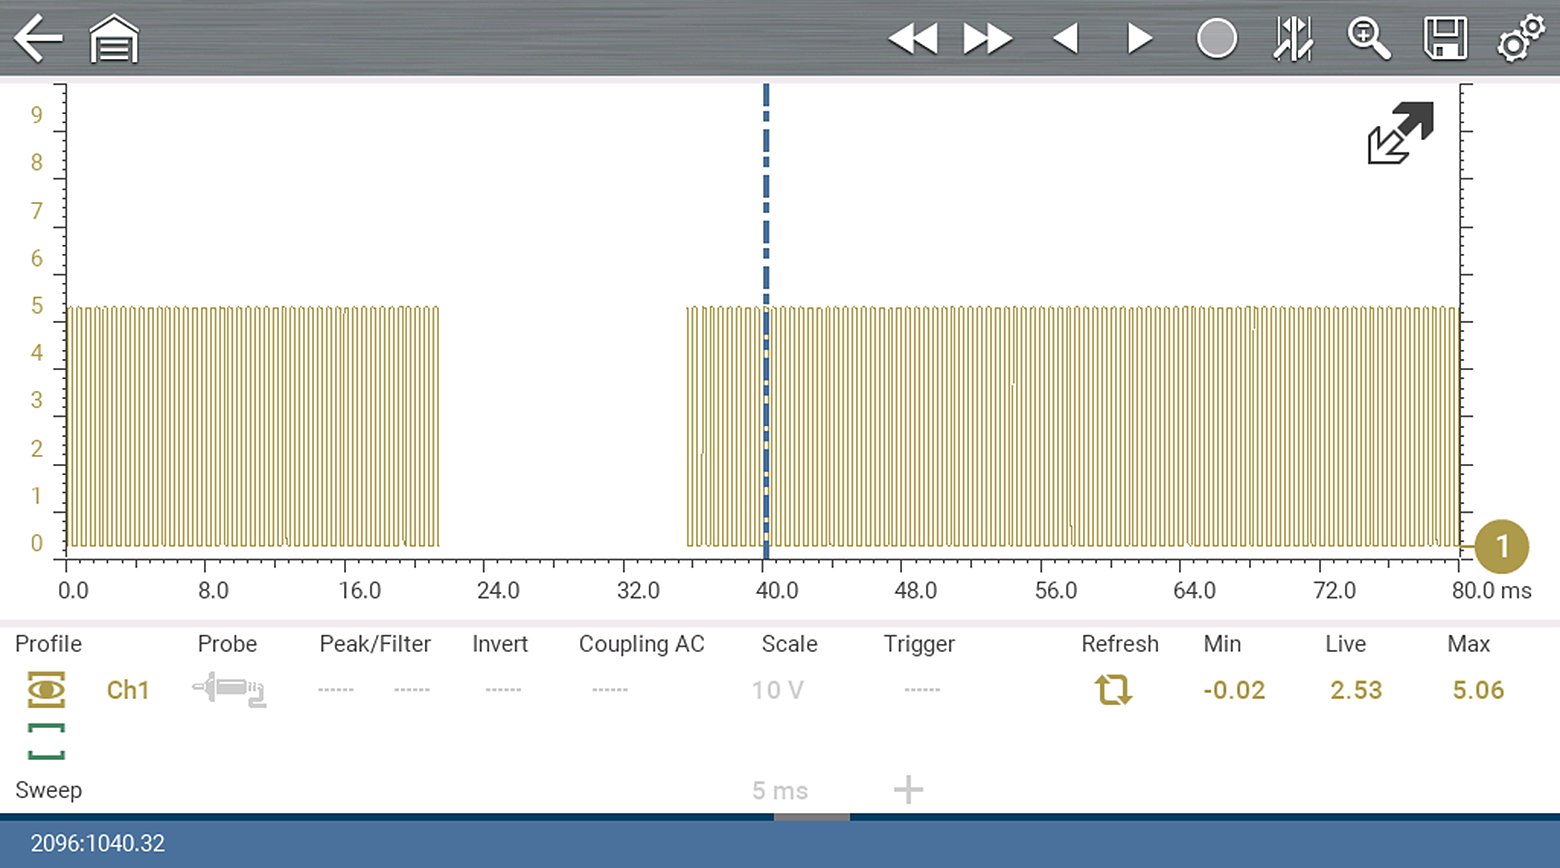
While monitoring a MAF (Mass Air Flow Sensor) signal, the waveform displays normally. As the signal is being monitored, an erratic “condition” suddenly develops, then goes away, but may have not been observed on the screen. Pausing the data capture (when such an event occurs) allows you to analyze the waveform using a higher zoom level (wider view) to look for a glitch in the signal.
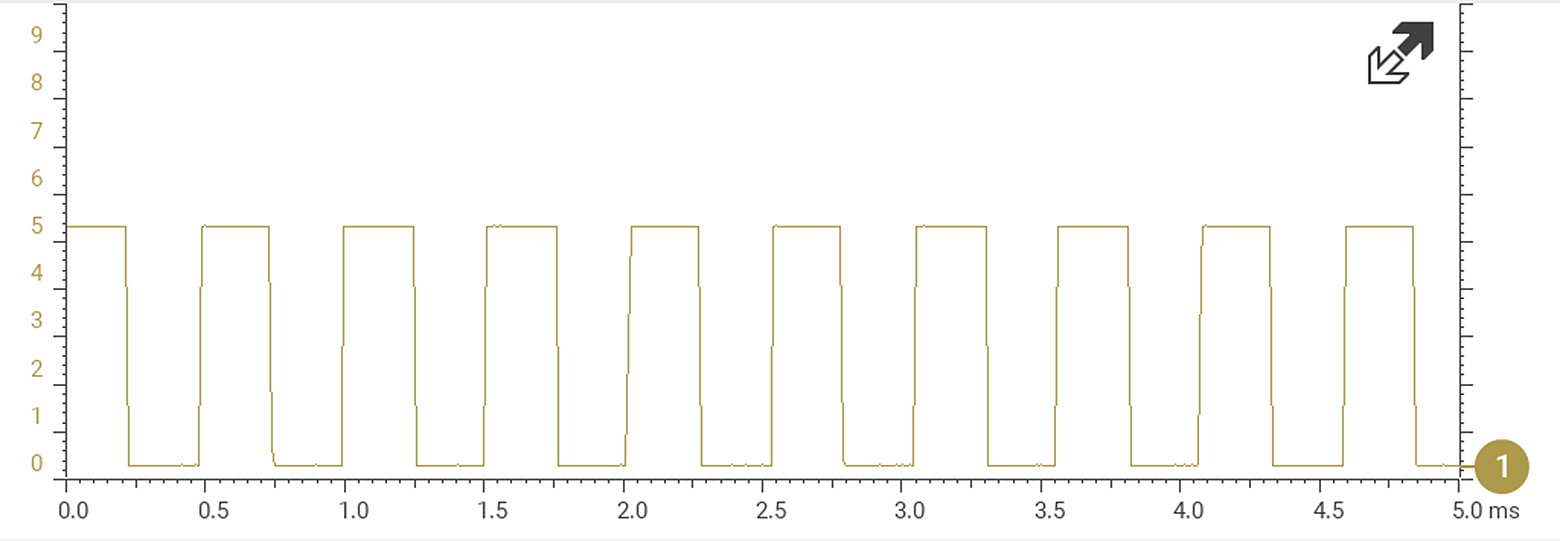
The following three illustrations show a generic square waveform to illustrate this method.
1 - Monitoring / Capturing waveform as it displays normally. You may not see a glitch, while monitoring at this setting.
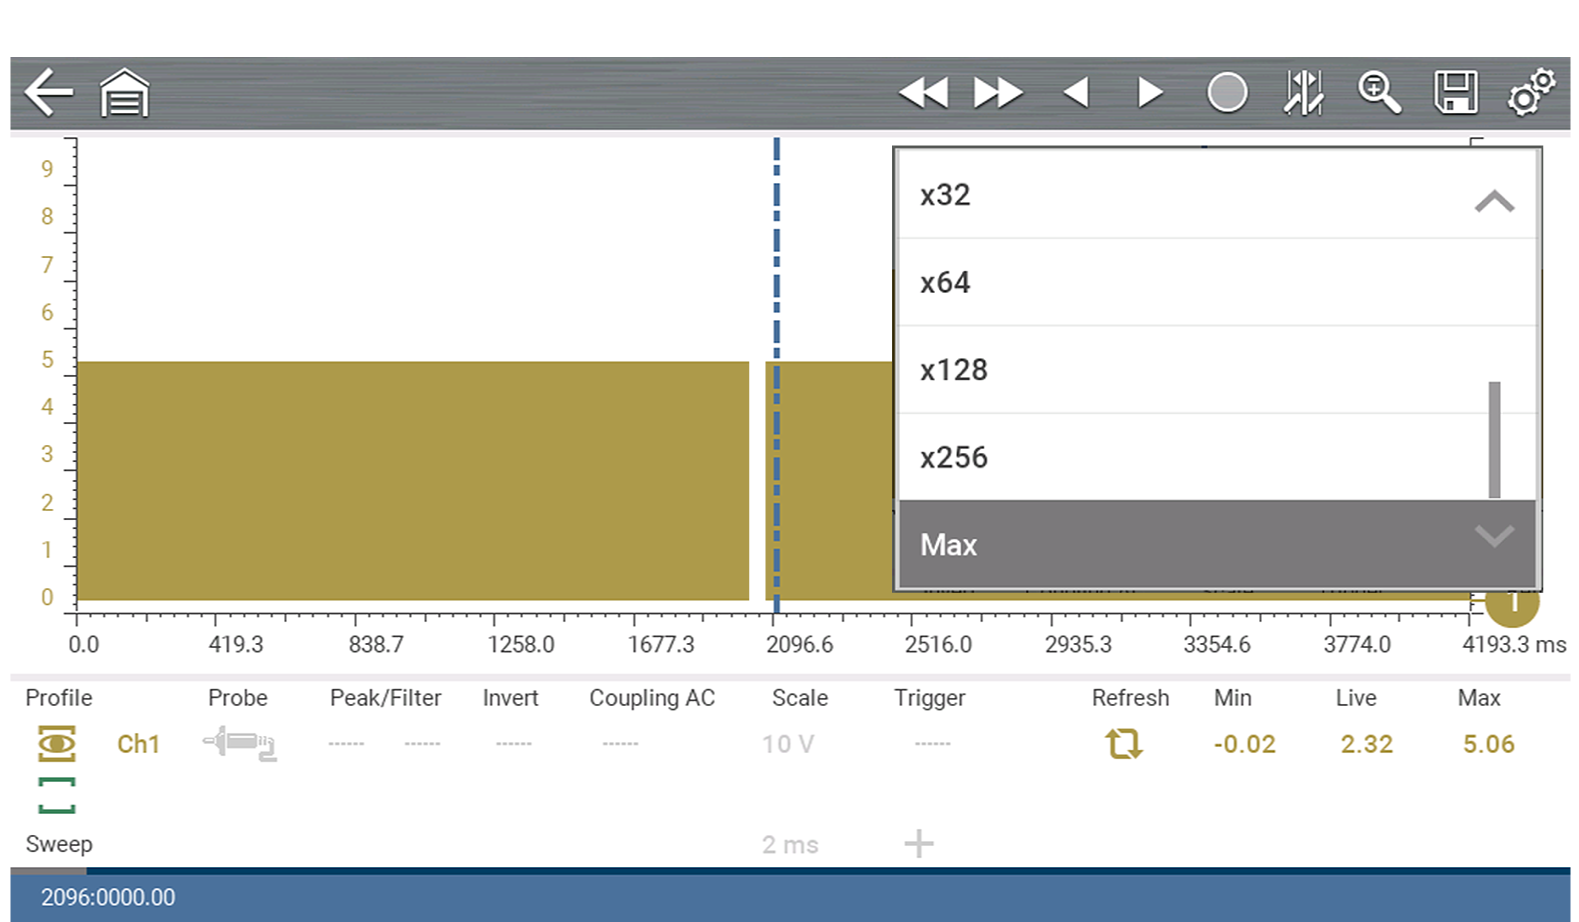
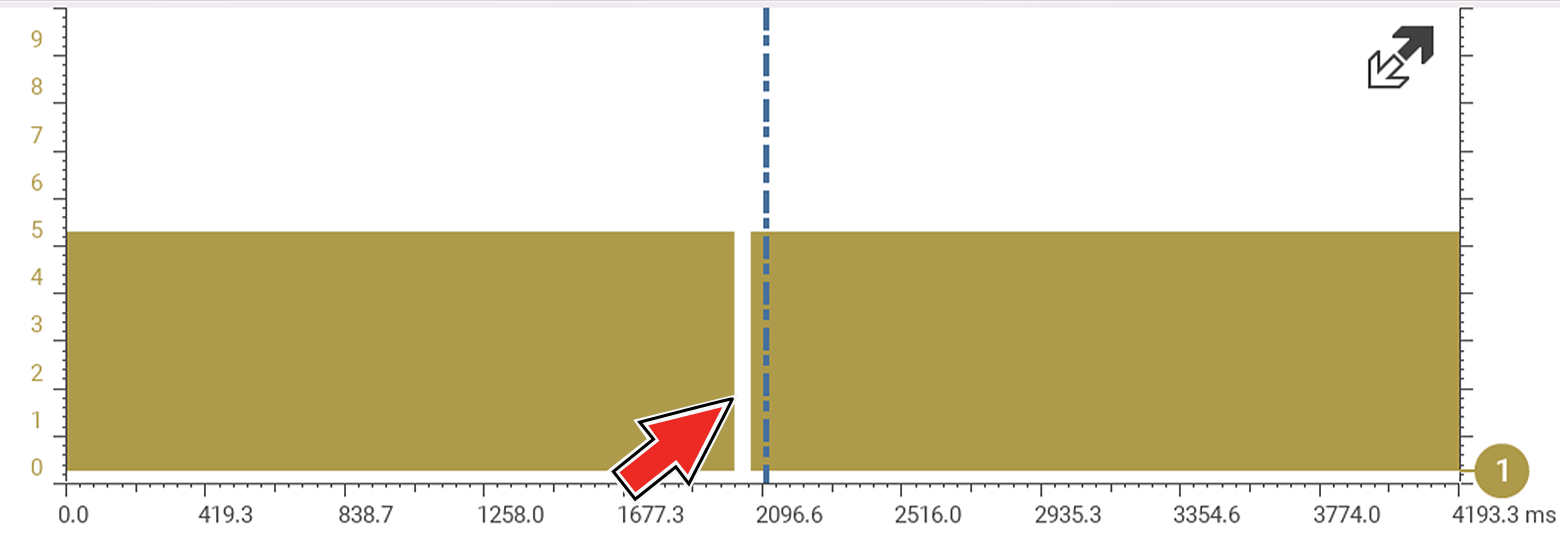
2 - Pause data capture and then zoom out (this example is at 256X) to see more data and to possibly find a glitch . In this example the cursor has been placed on the right side of a glitch. The waveform is too compressed to see any detail, however the glitch stands out as a thin light area in the waveform.
3 - Zoom back in (this example is at 8X) to view more detail in the area where the cursor was placed by the glitch.