Diagnostics Menu
Once you are connected to the vehicle, the Diagnostics Menu displays.
The Faults screen is the default display on the Diagnostics Menu. Other selections are available on the left side of the display (e.g., Engine, Calibrations, Tests).
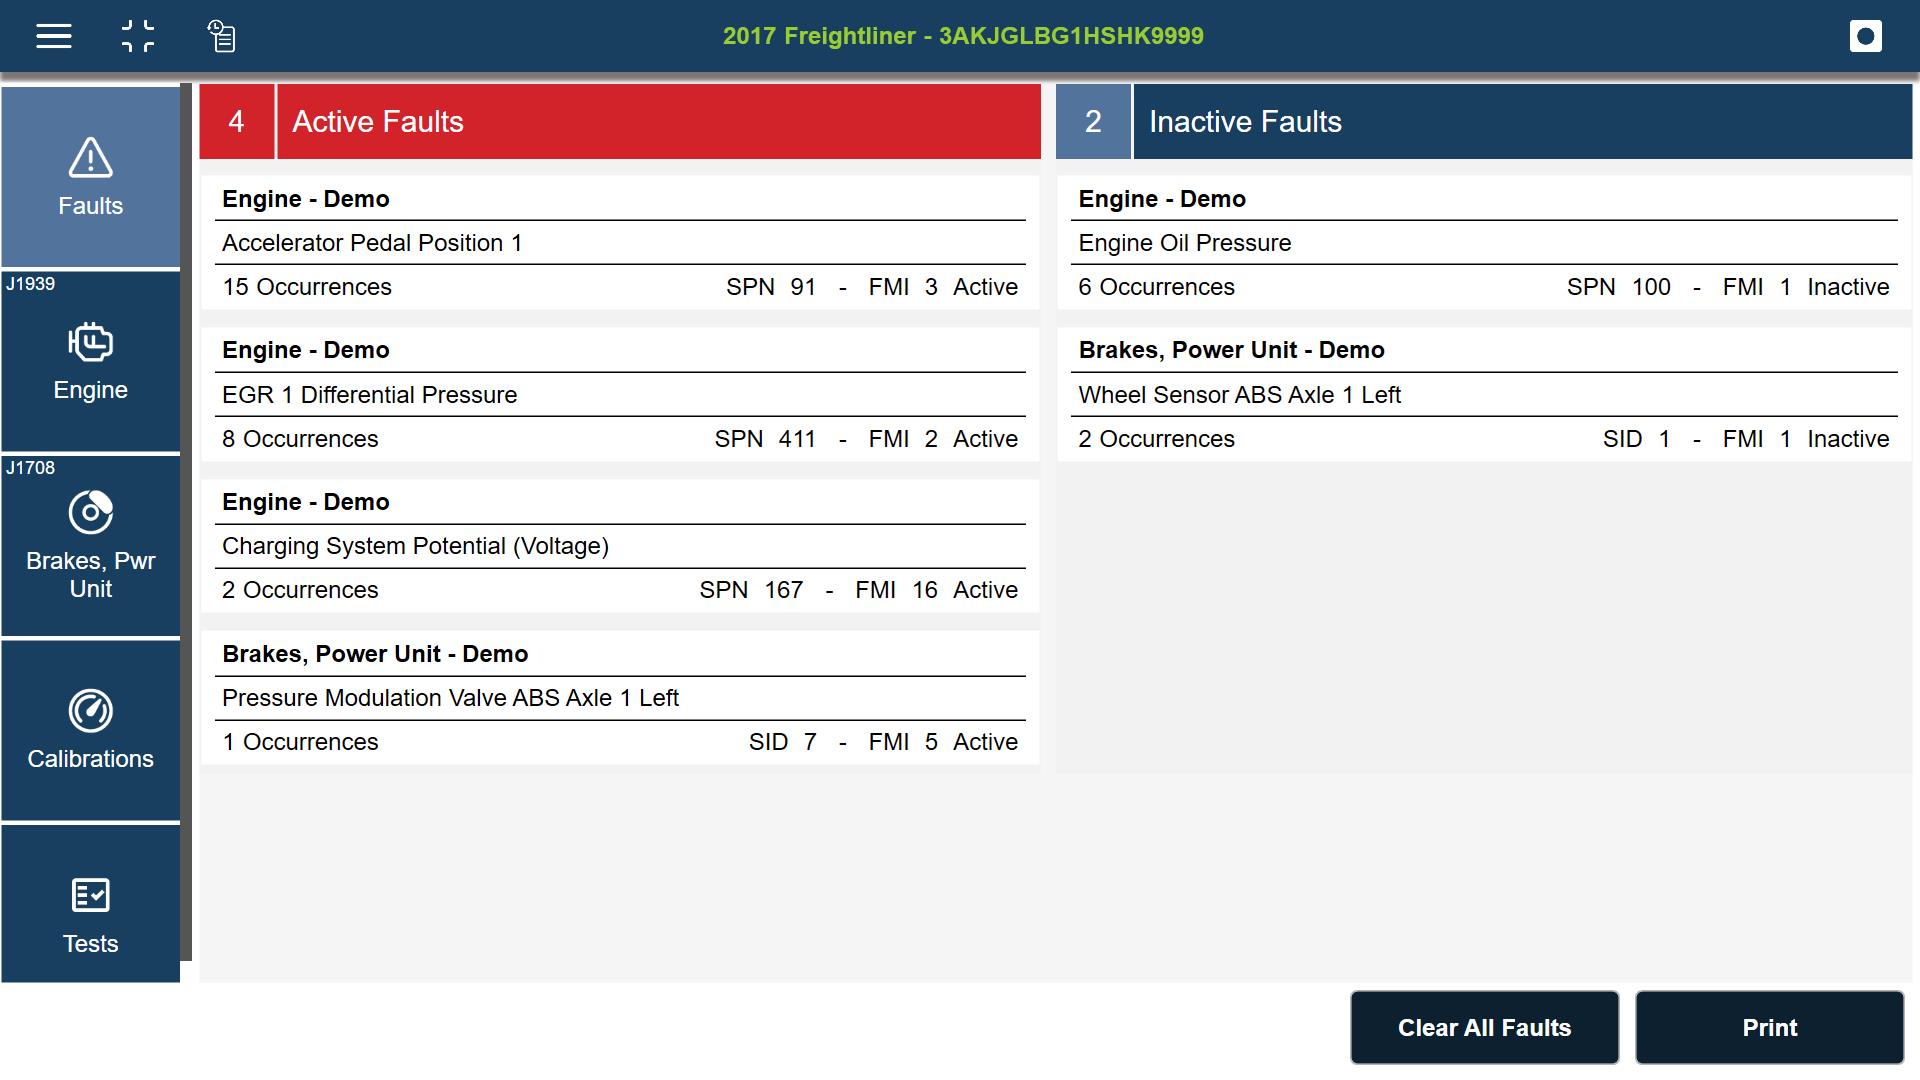
The Faults screen is the default display on the Diagnostics Menu.
From the faults screen display you can:
| ● | View active and inactive faults |
| ● | View more information on a particular fault |
| ● | Clear All Faults |
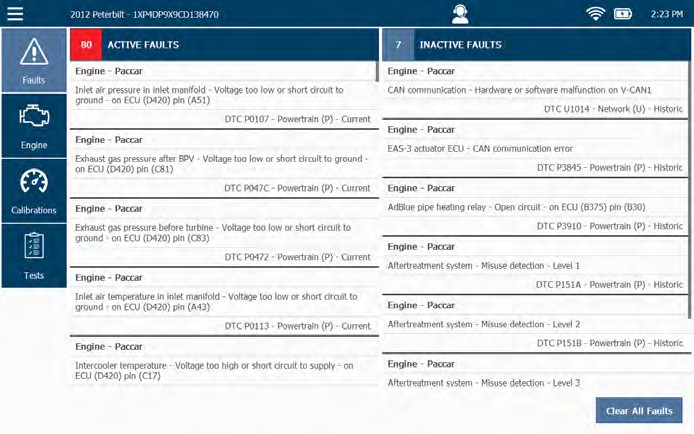
Each fault listed may contain the following information:
| ● | The name of the module where the fault was found (e.g., Engine 1 - Paccar) |
| ● | Either the name of the parameter experienc- ing the fault, or a combination of the name and a description of the fault (e.g., Inlet air pressure in inlet manifold - Voltage too low or short circuit to ground - on ECU (D420) pin (A51). |
| ● | SAE/DTC information about the fault (e.g., DTC P0101 - Powertrain (P) - Current) |
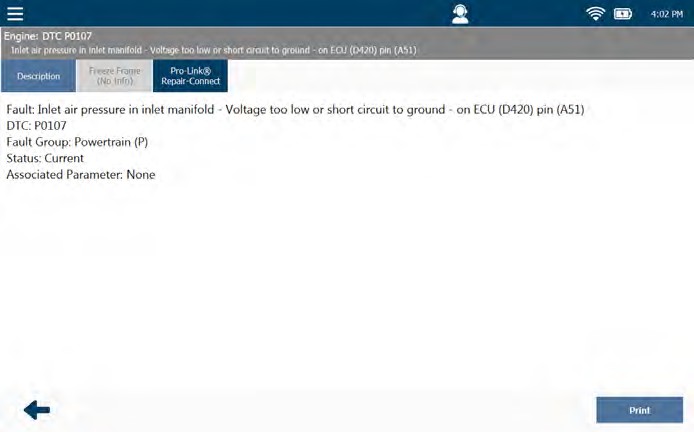
You can view more information on a particular fault (e.g., Freeze Frame Data and PRO-LINK® RepairConnect troubleshooting information) by selecting the fault.
If you are subscribed to RepairConnect, you can login from this screen
Inactive faults can be cleared by selecting Clear All Faults, faults may not be cleared individually.
When you clear all faults, both ACTIVE and INACTIVE faults are cleared, then it re-scans the vehicle and re-lists the ACTIVE faults found during the re-scan.
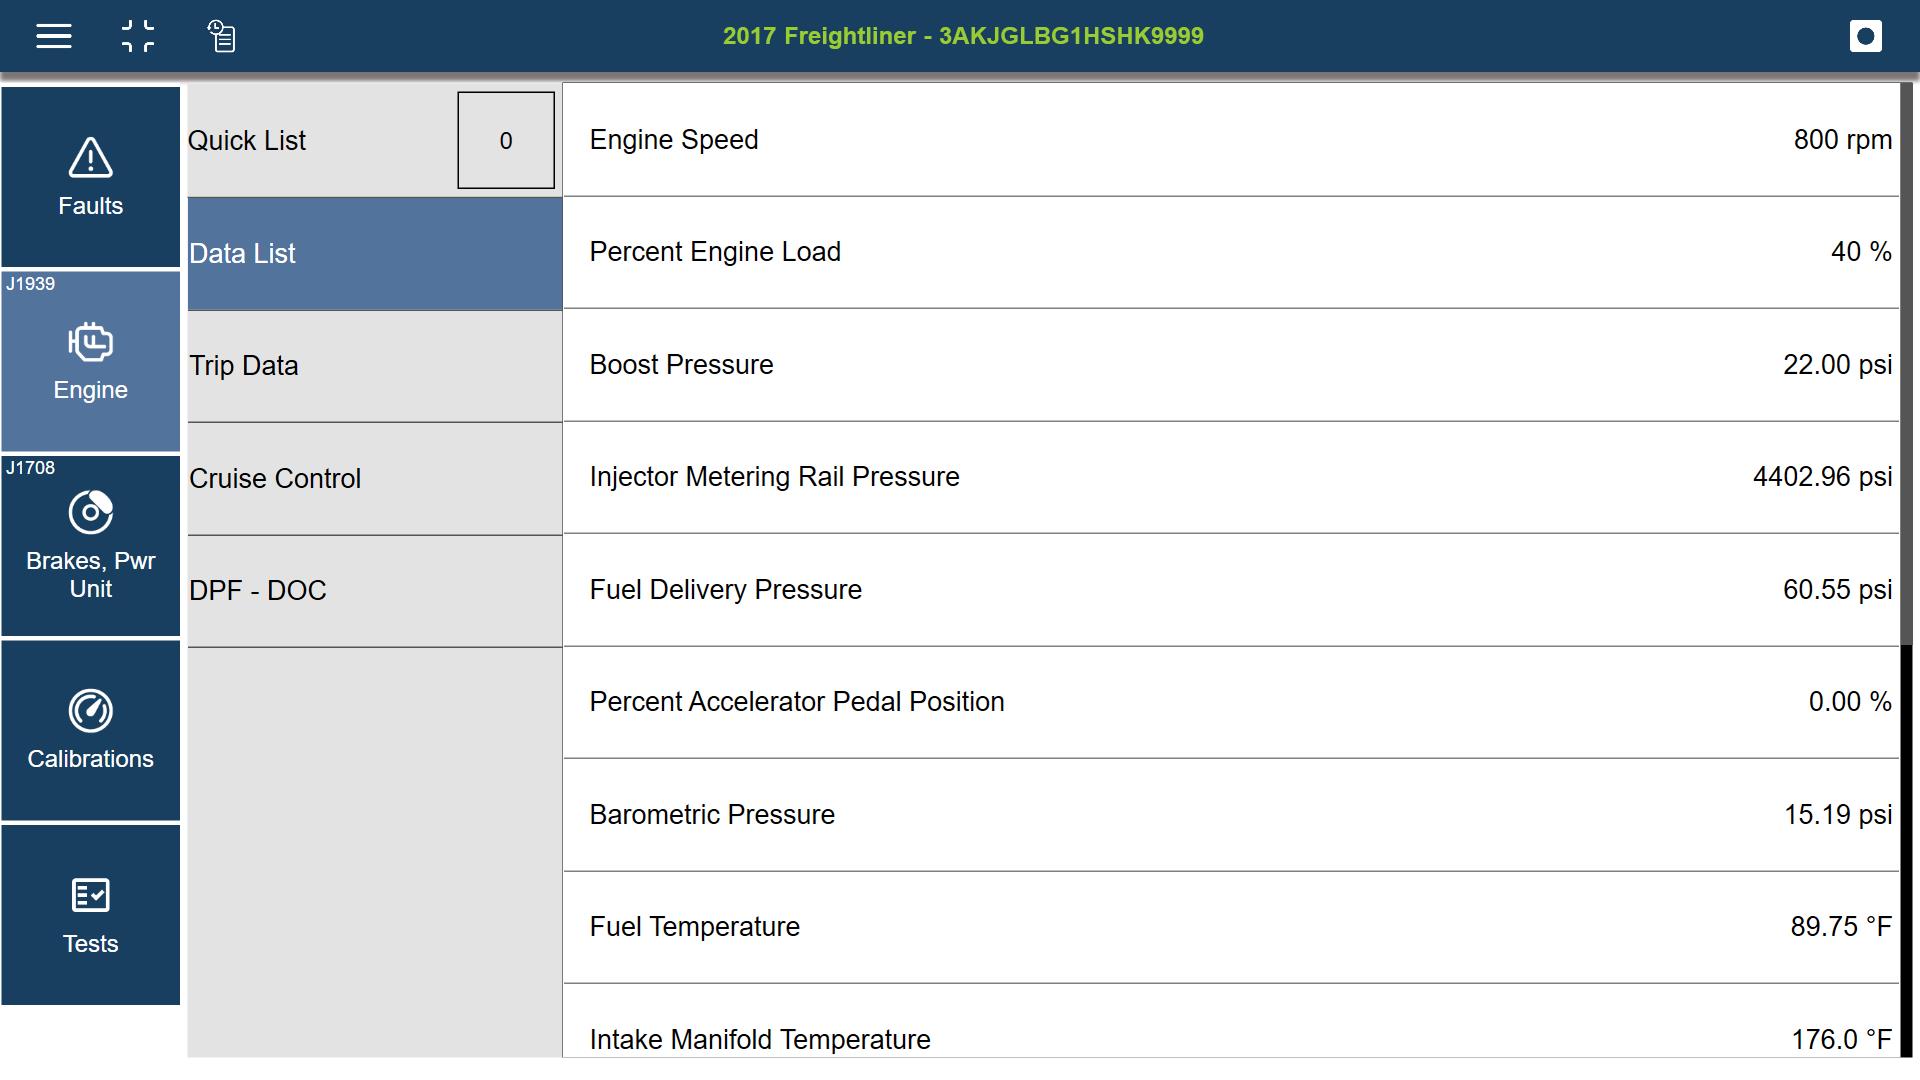
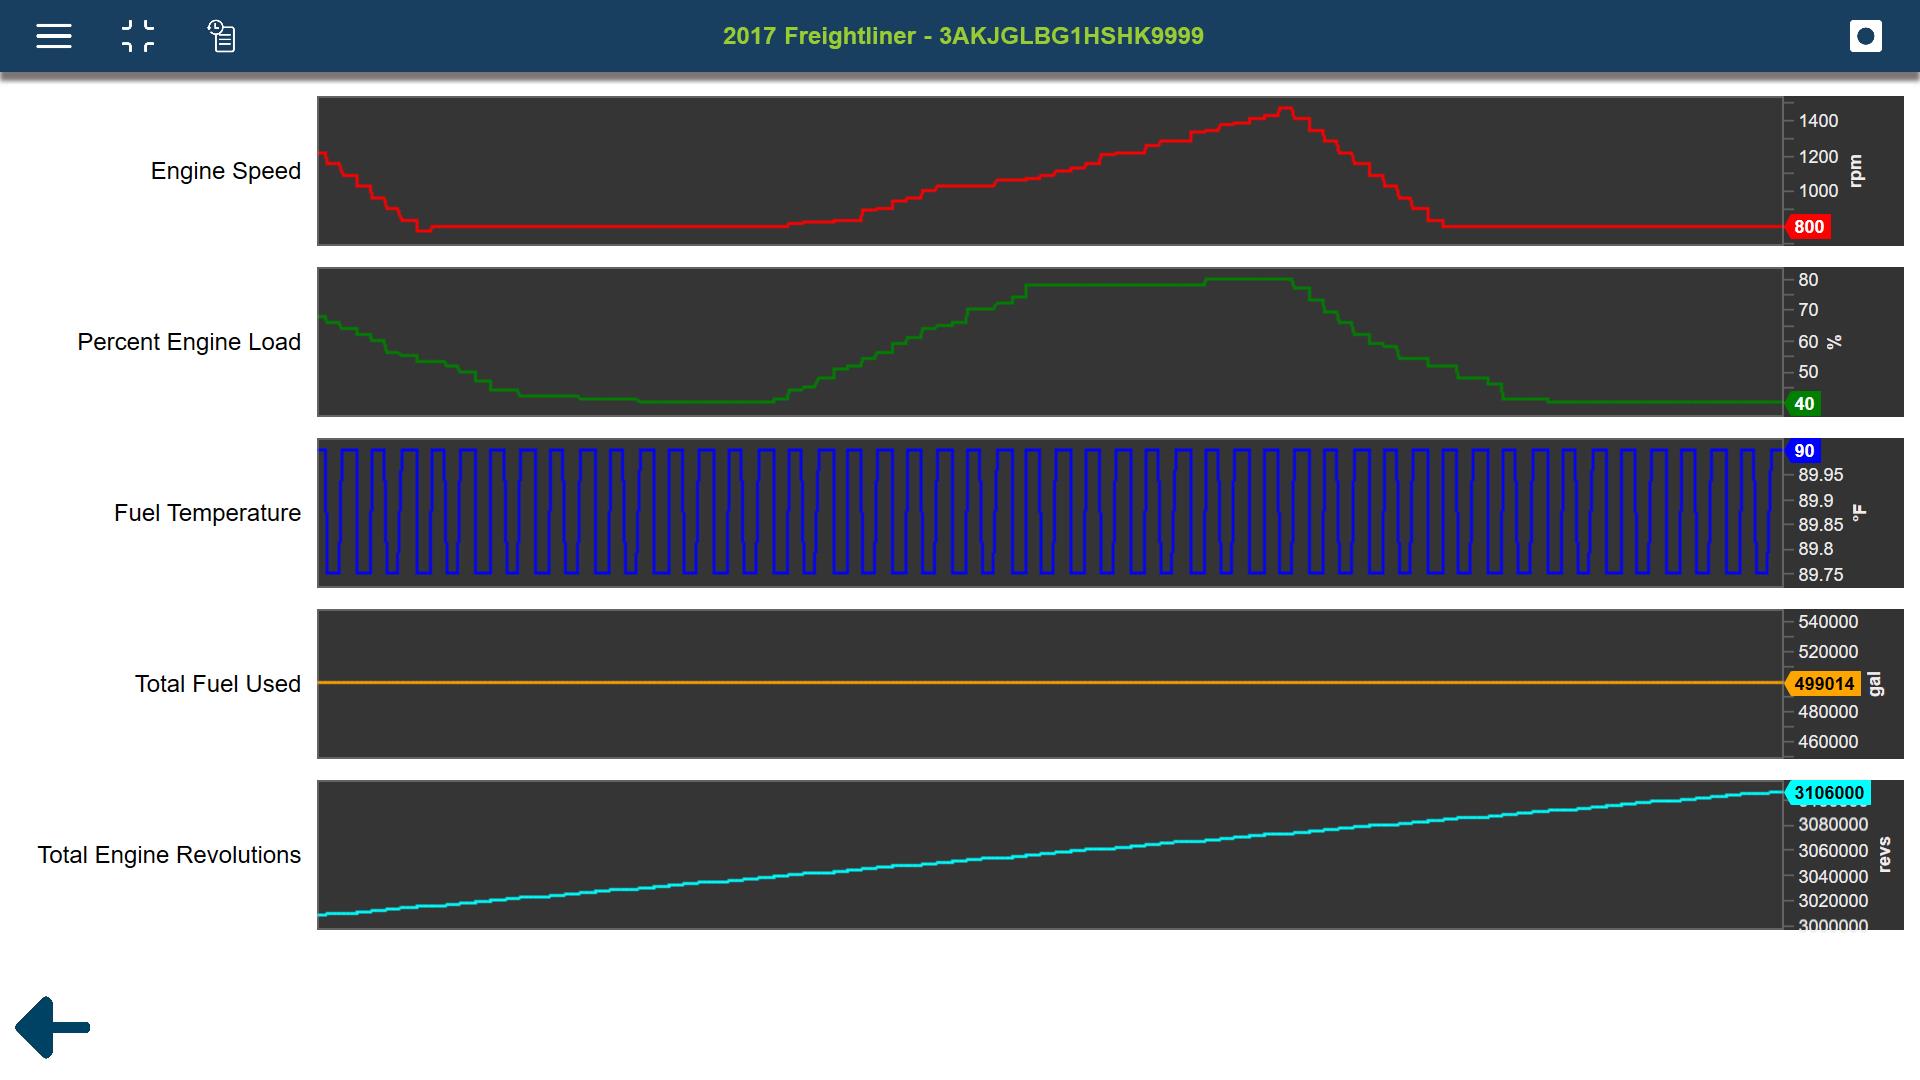
The Parameters (PIDs) screen displays the parameters that are available for each available module . Typical systems may include Engine, Cruise Control, Engine Retarder, etc.
From the Parameters tab you can:
| ● | View parameters as a list or graph |
| ● | Create and manage a Quick List (custom PID list) |
Select the desired parameter tab to view specific parameters.
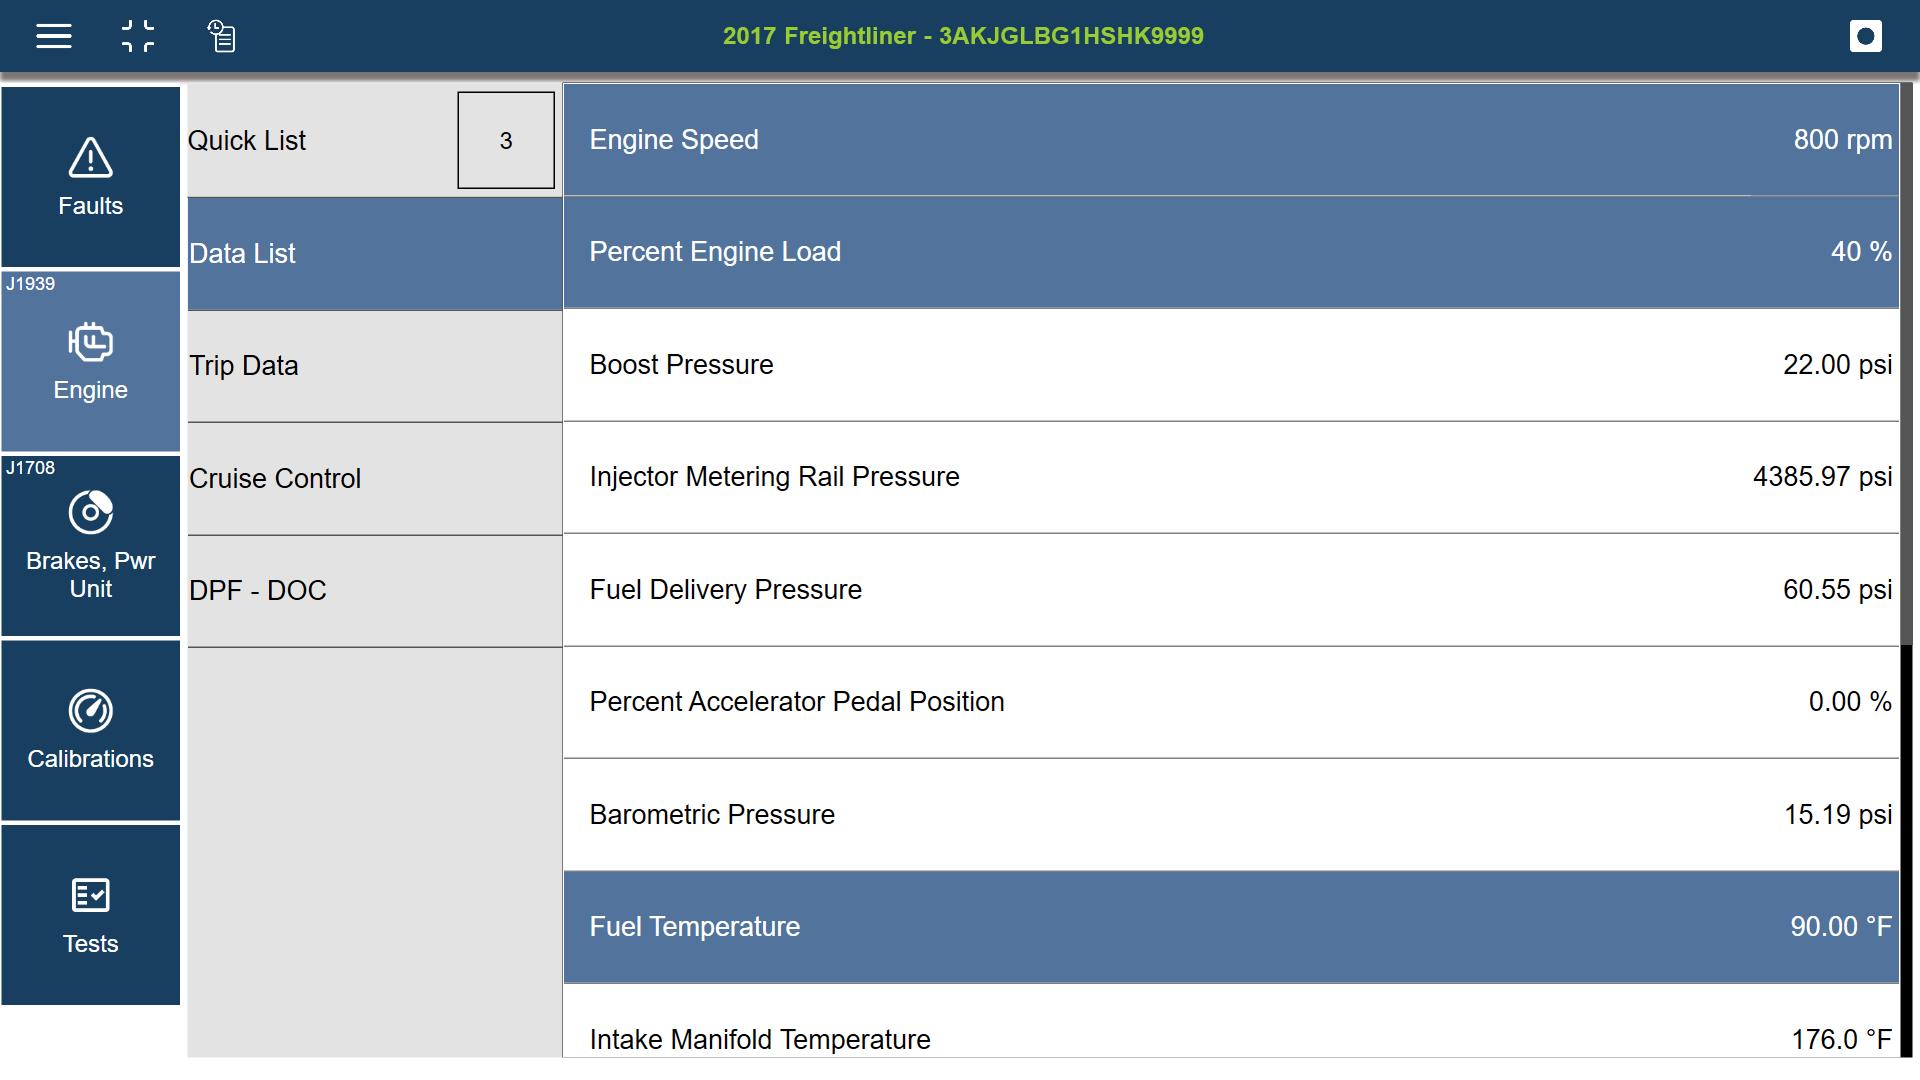
You can create a custom PID list by selecting the PIDs you need and display them together in a custom list.
Select PIDs (up to ten) from any of the displayed module tabs (highlighting them) for use in your Quick List. As you select PIDs, you will notice they remain highlighted and the count in the Quick List tab increases.
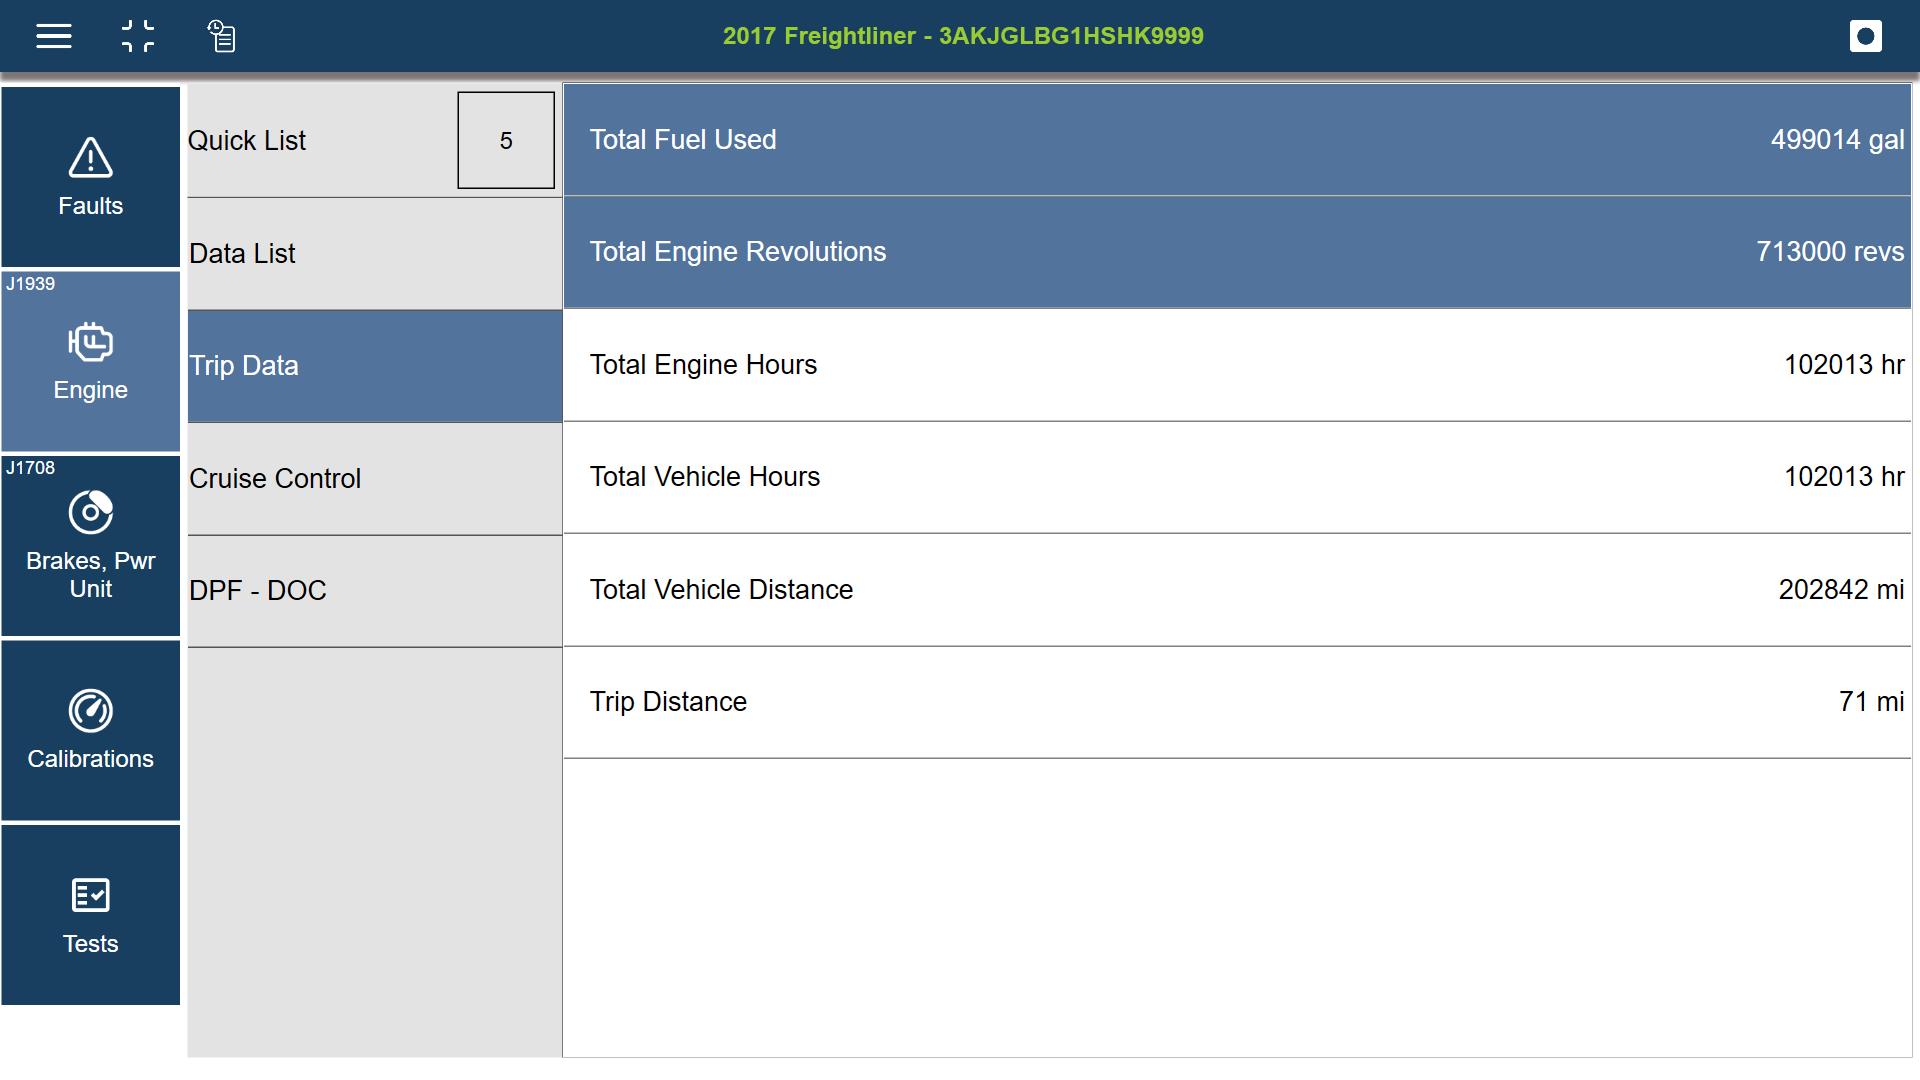
Once you have selected all the PIDs you need, click on the Quick List tab to view your custom list.
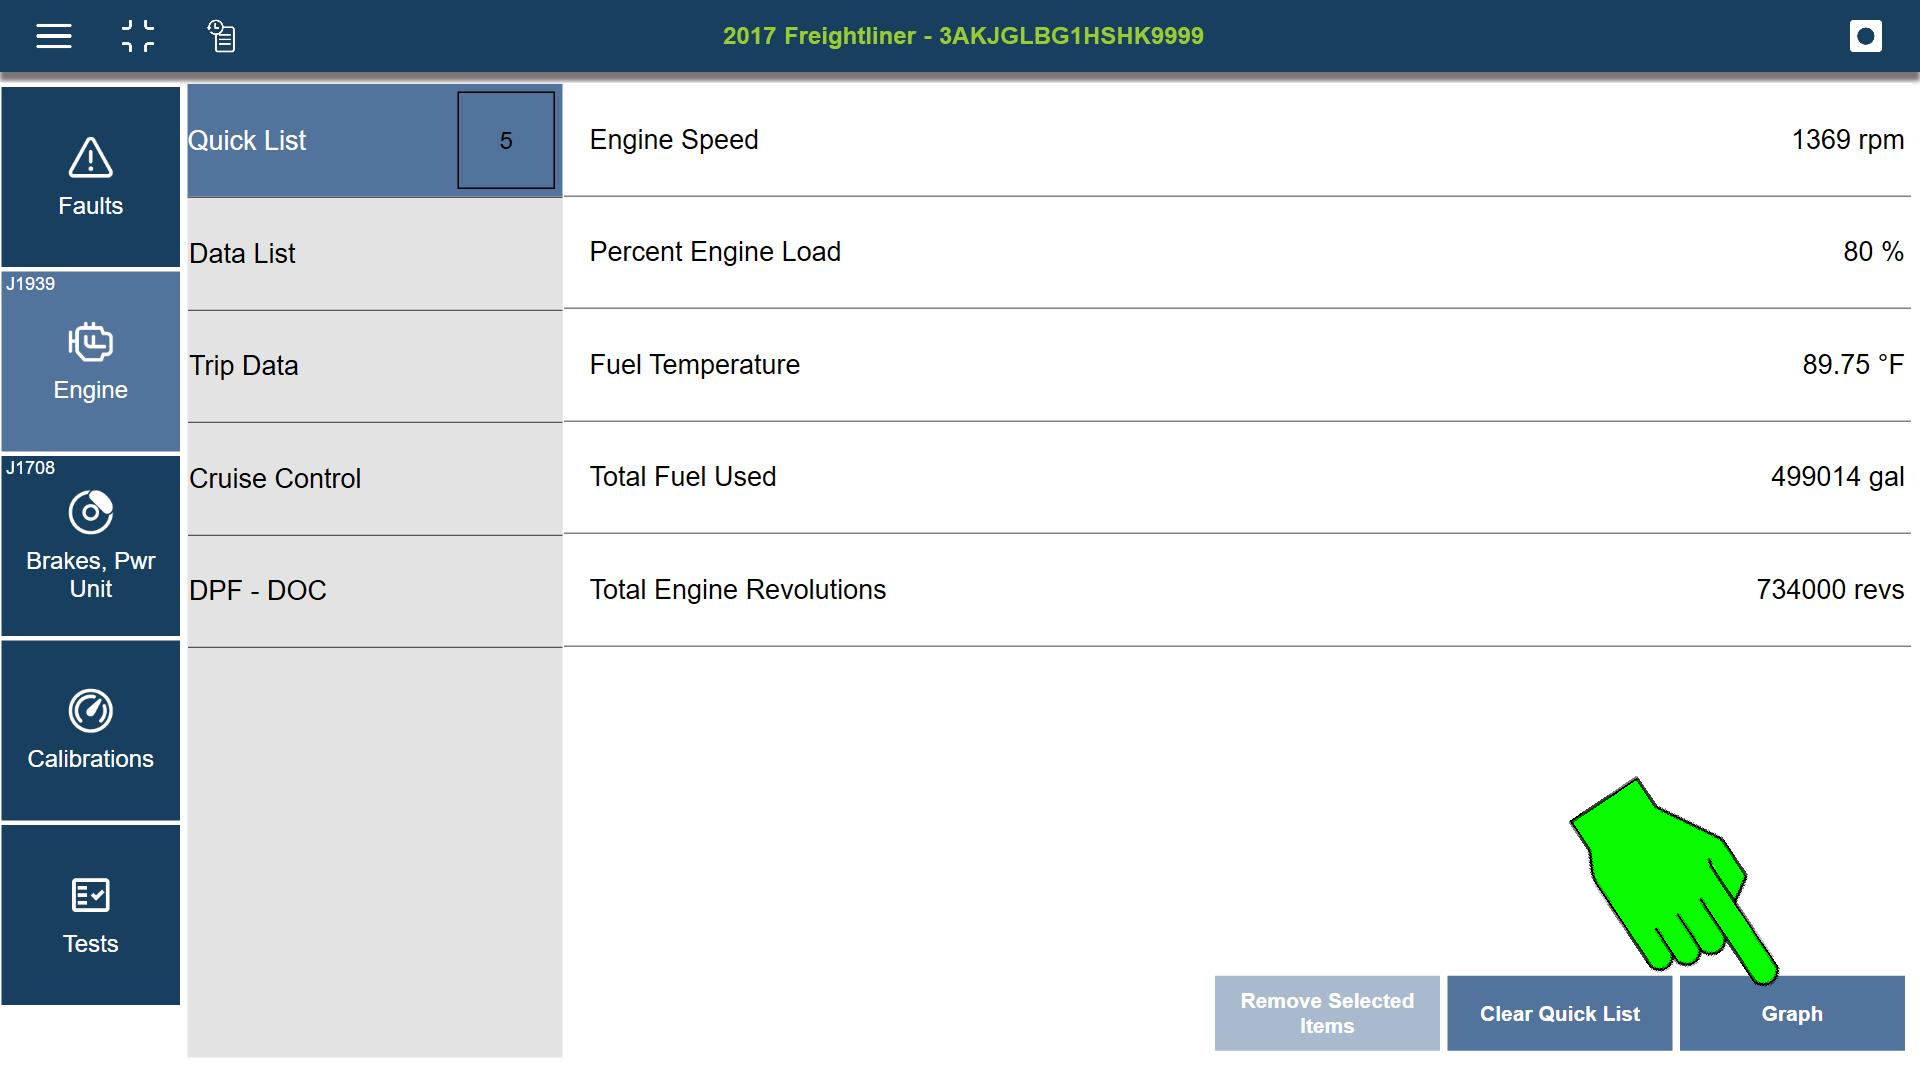
To view a PID in graph view it must be part of a Quick List.
From the Quick List, select Graph.
Only scalable parameters (i.e. pressure and temperature (PIDs that have values that can vary over time)) will be displayed.
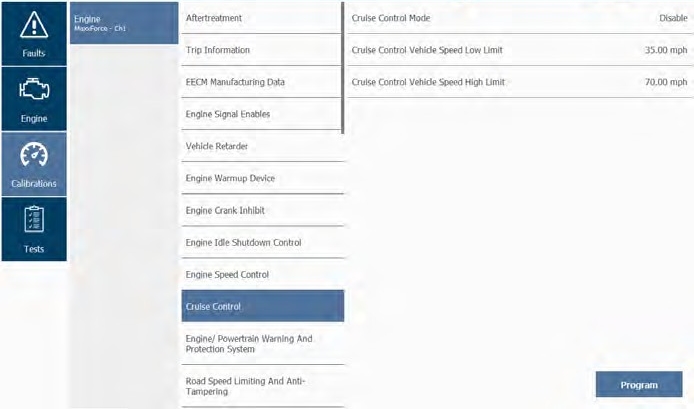
The Calibrations screen displays calibrations that are available for a specific vehicle and module.
Each calibration is unique as there are various types of modules and calibrations. Some calibrations may require, passwords, and some may have special instructions. The Program button is not universally used across all vehicle applications, as some tests may not require the Program function.
If you are prompted to enter a password, follow the prompts. In some cases the system may automatically enter the password for you, if not refer to vehicle service information.
Calibrations are not available for all software applications. For example, Heavy Duty Standard (HDS) J1939, among others, does not support calibrations. The Calibrations tab will still display, but a “No Calibrations available message” is displayed when the tab is selected.
| 1. | Select a module (e.g., Cruise Control, Engine) to see available categories. |
| 2. | Select a calibration (e.g., Cruise Control Vehicle Speed High Limit). |

| 3. | Enter a new value as indicated and then click Update. |
In this example, Cruise Control is updated with the new value.

| 4. | Click the Program button to finalize the calibration. |
| 5. | Follow all onscreen instructions to complete the calibration. |
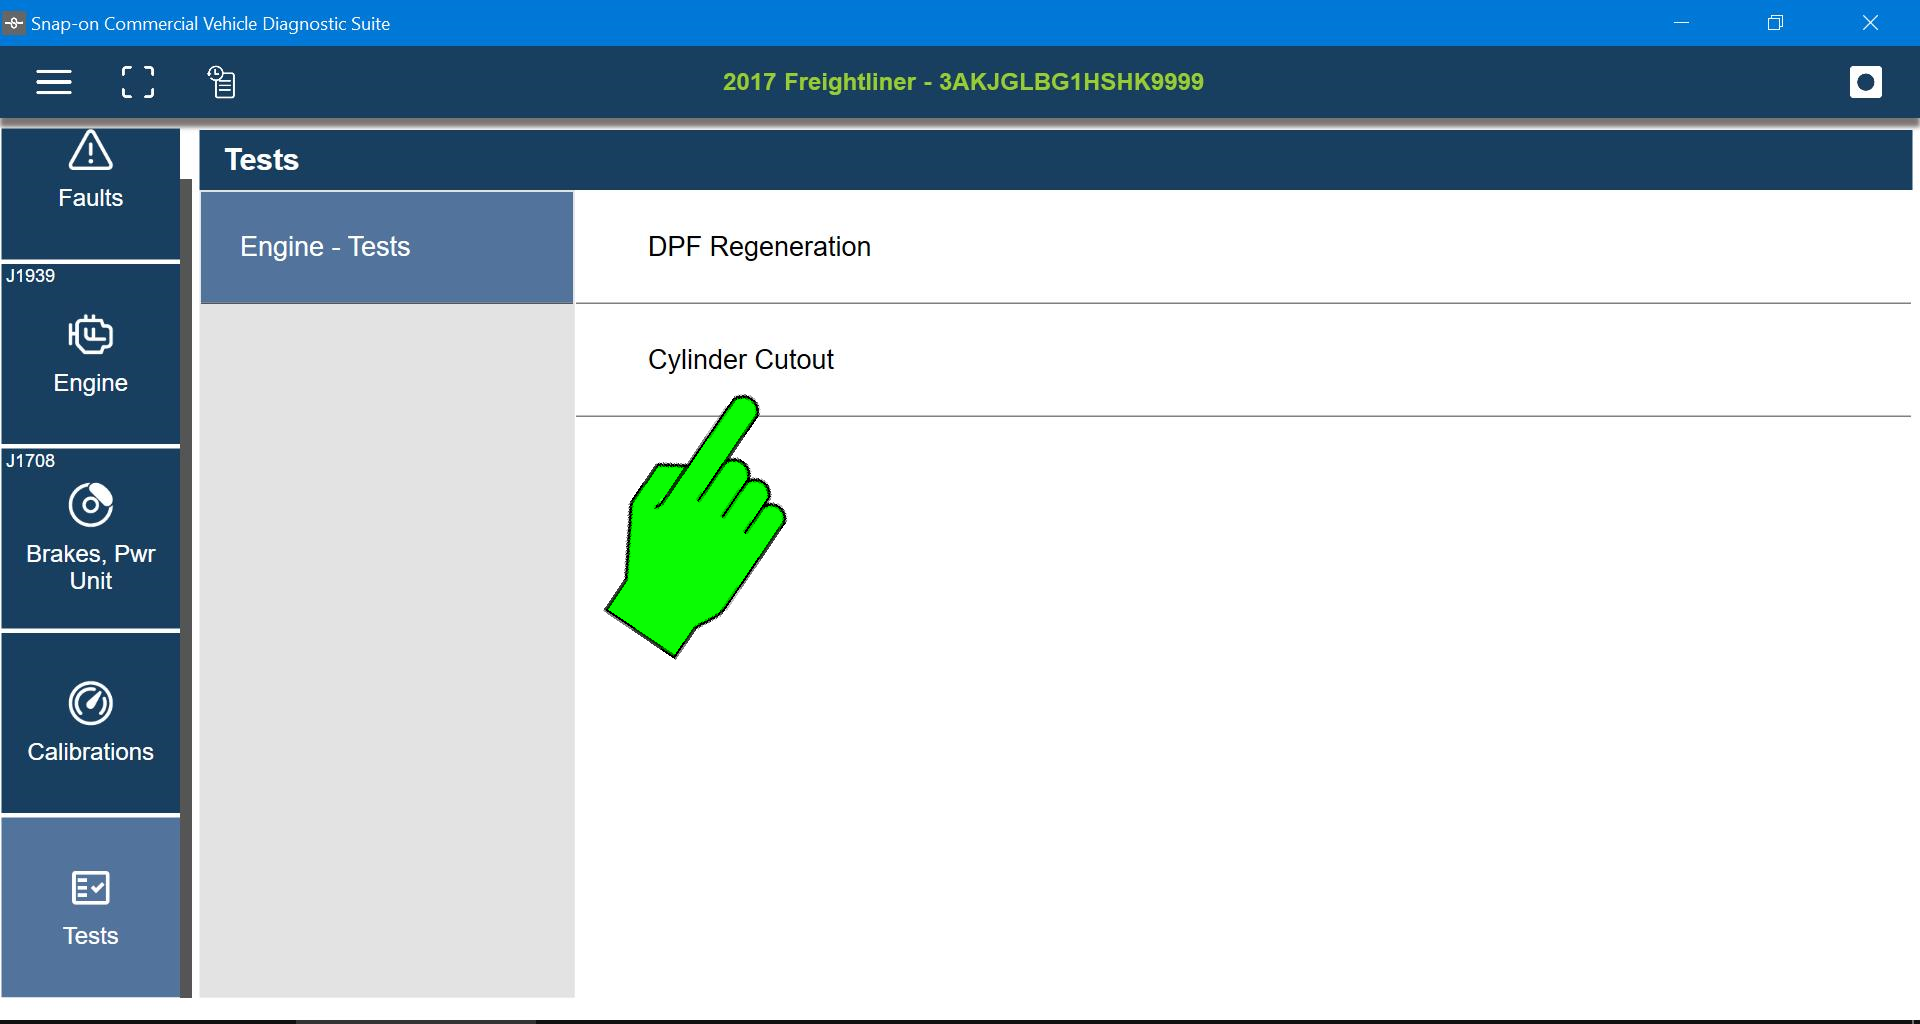
The Tests screen displays bi-directional tests that are available for a specific vehicle and module.
Typical tests include:
| ● | Histograms |
| ● | Cylinder Cutout |
| ● | Injector actuation pressure tests |
| ● | Injector solenoid tests |
Each test is unique as there are various types of modules for specific vehicles. In addition, the screen associated with each test is unique to that test. Most special tests include Info Text (e.g., detailed instructions on running that particular test, quick steps for multiple routines, and test tips).
Tests are not available for all vehicles or modules. For example, Heavy Duty Standard (HDS) J1939, among others, does not support tests. If tests are not available for a specific module, the module will not display in the list of modules.
Some tests include special instructions, this is indicated by a "Text Info" icon in the upper-right corner of the test screen.
Some tests require the vehicle to be in a particular state (e.g., Engine Coolant Temperature greater than 140 °F). If this is the case for the test you select, the onscreen instructions must be followed before starting the test. Once you have met the prerequisites for the test, the screen for that test is displayed.
| 1. | Select a module (e.g. Engine, Brakes) to display a list of available tests. |
| 2. | Select a test from the list (e.g. Cylinder Cutout, Injector Code Programming). |
In some cases, a safety message screen is displayed. Read and follow all safety messages.
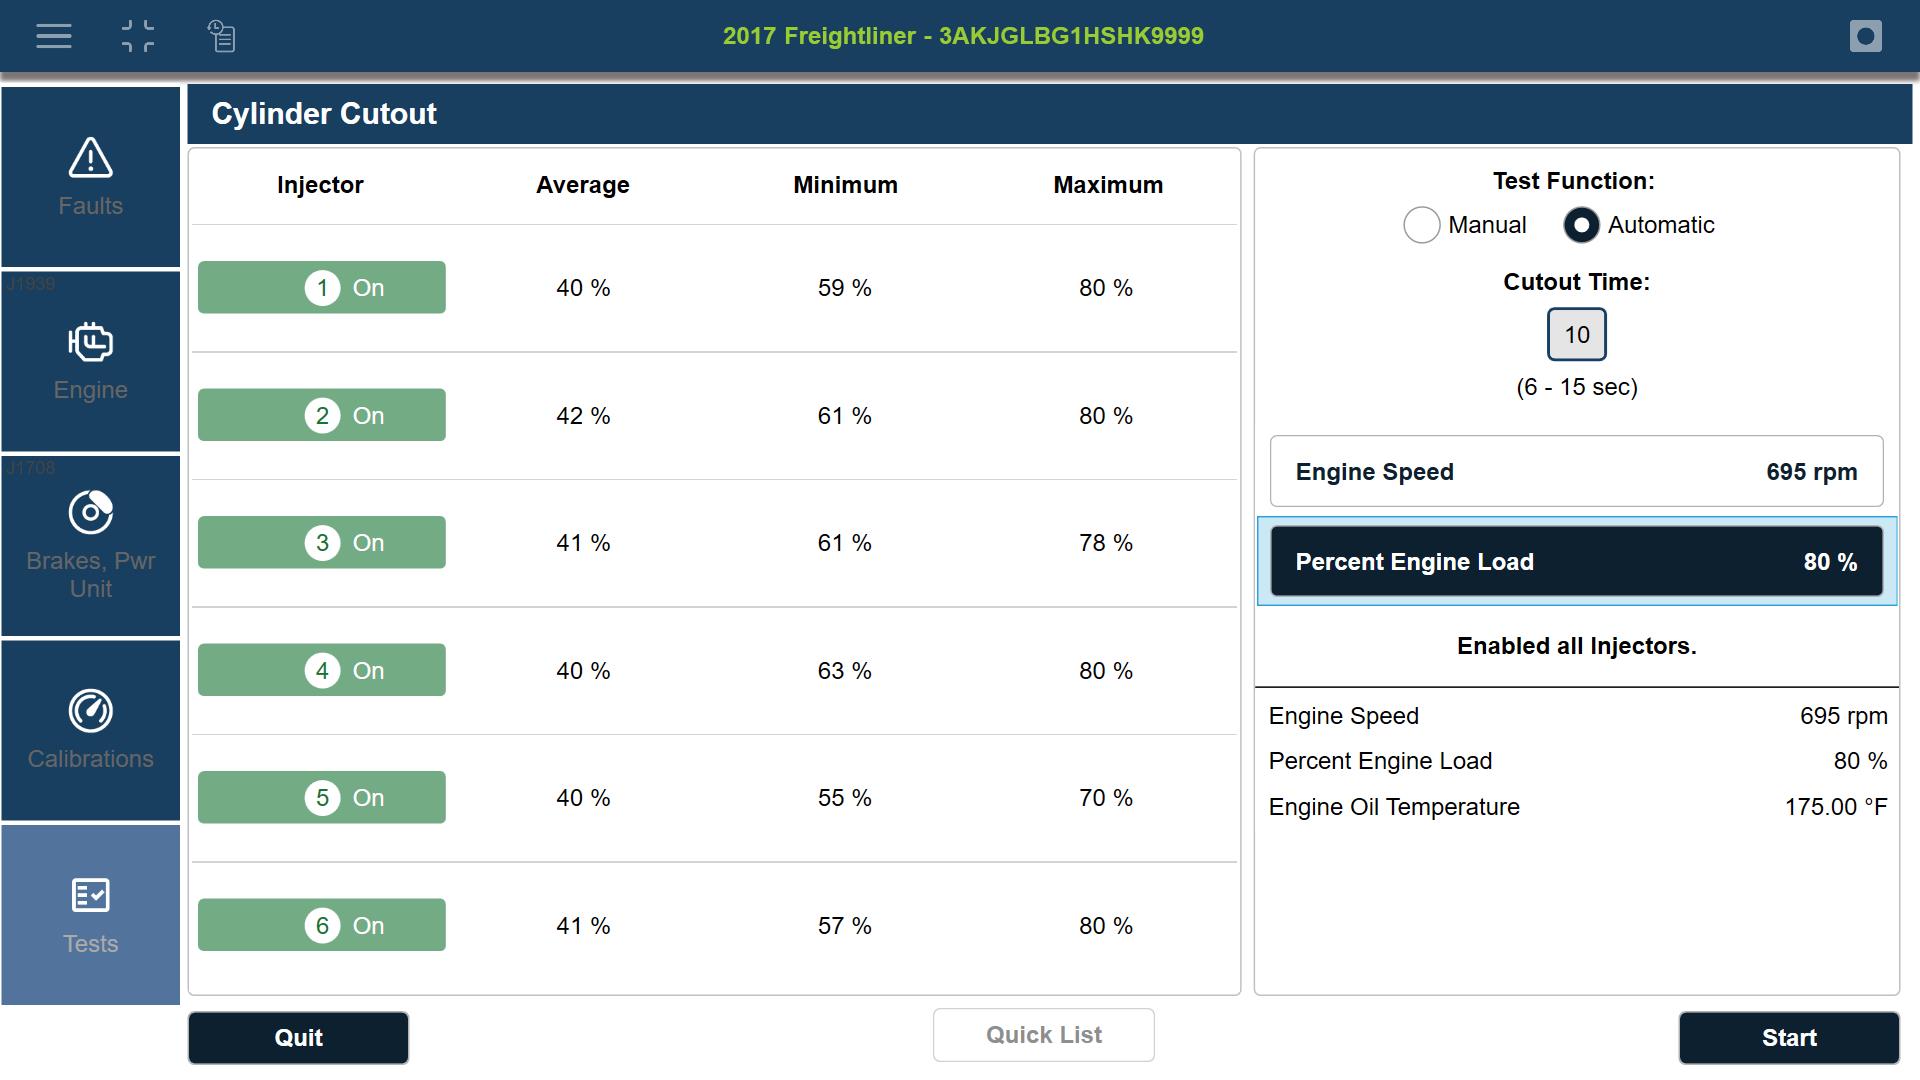
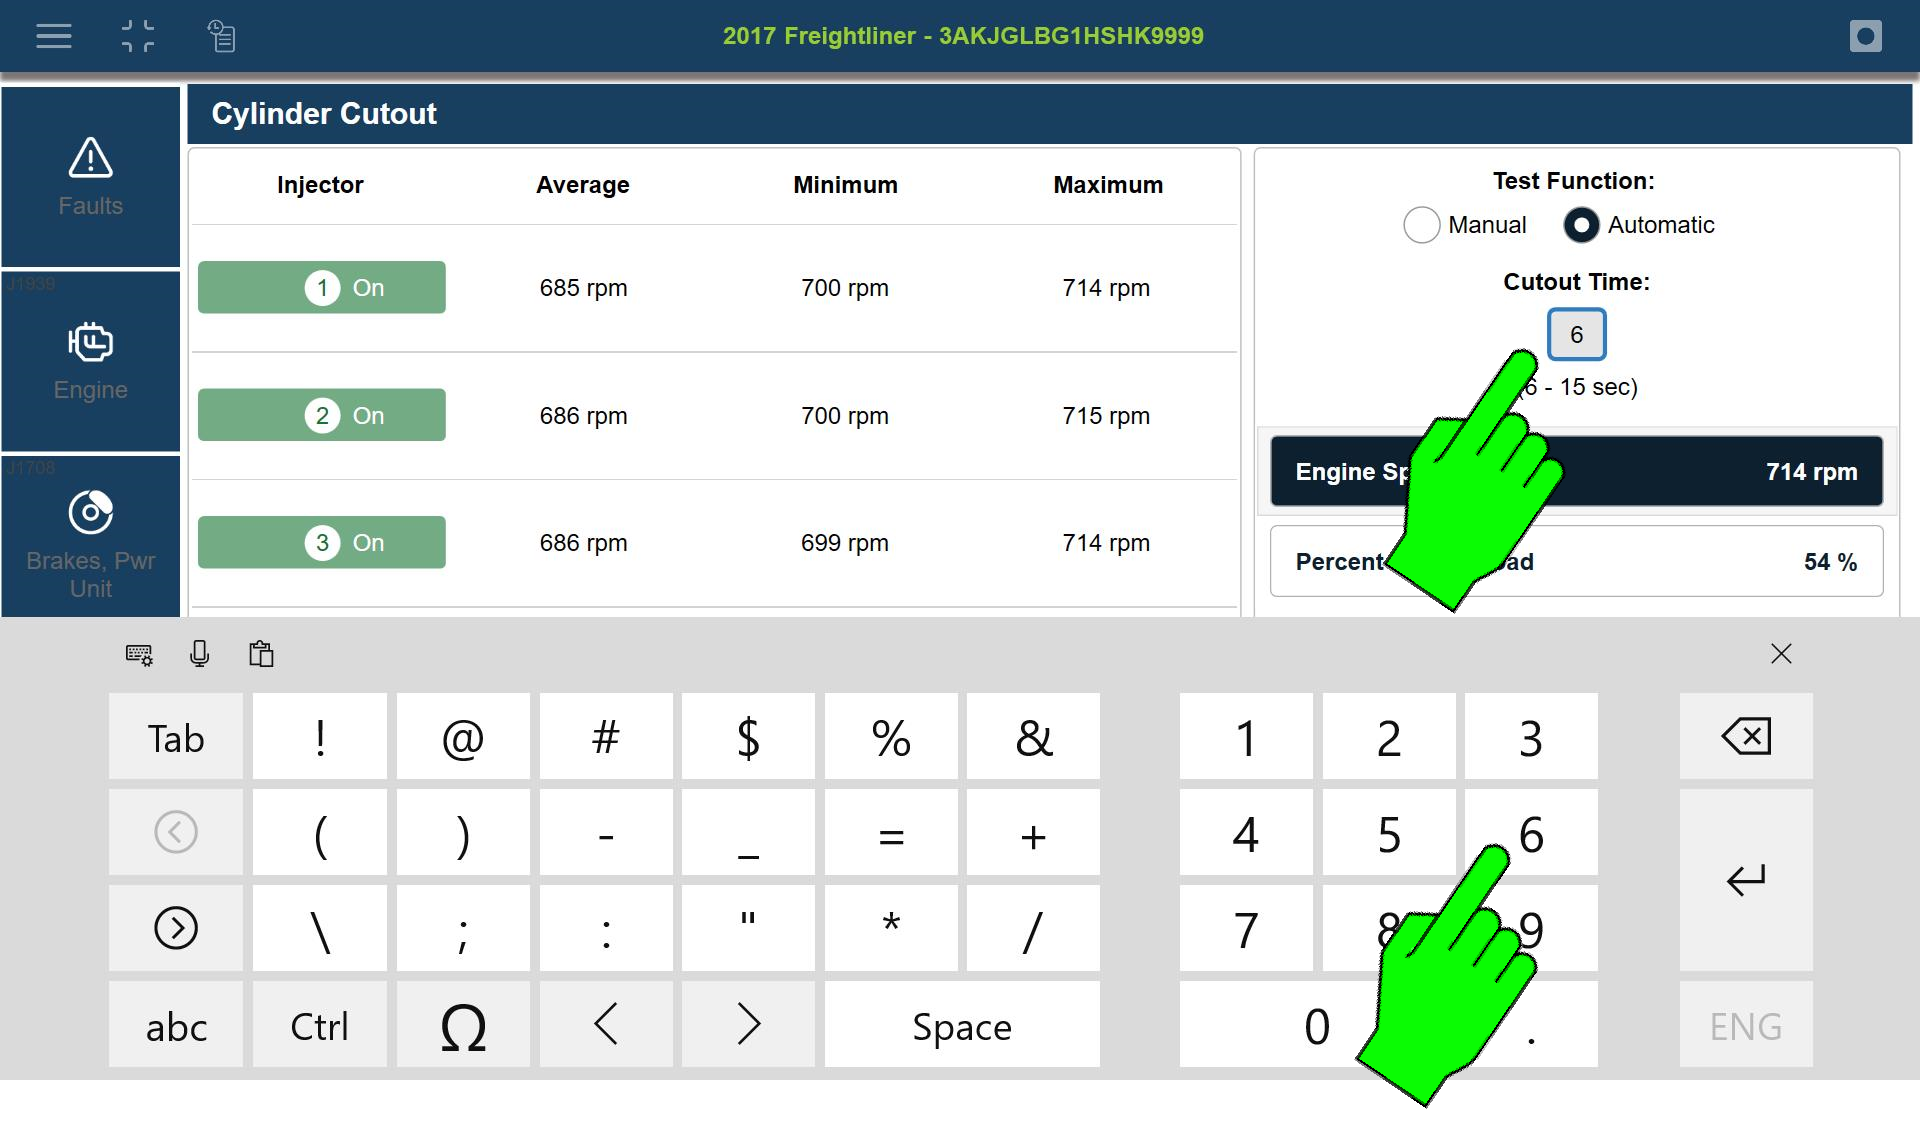
In the example below, the Cylinder Cutoff test is displayed.
Each test may have unique instructions and /or settable testing options.
In this example, you can
| – | change the cutout time between 6 and 15 seconds |
| – | select manual or automatic test activation |
| – | change display view between engine speed or engine load percentage |
| – |
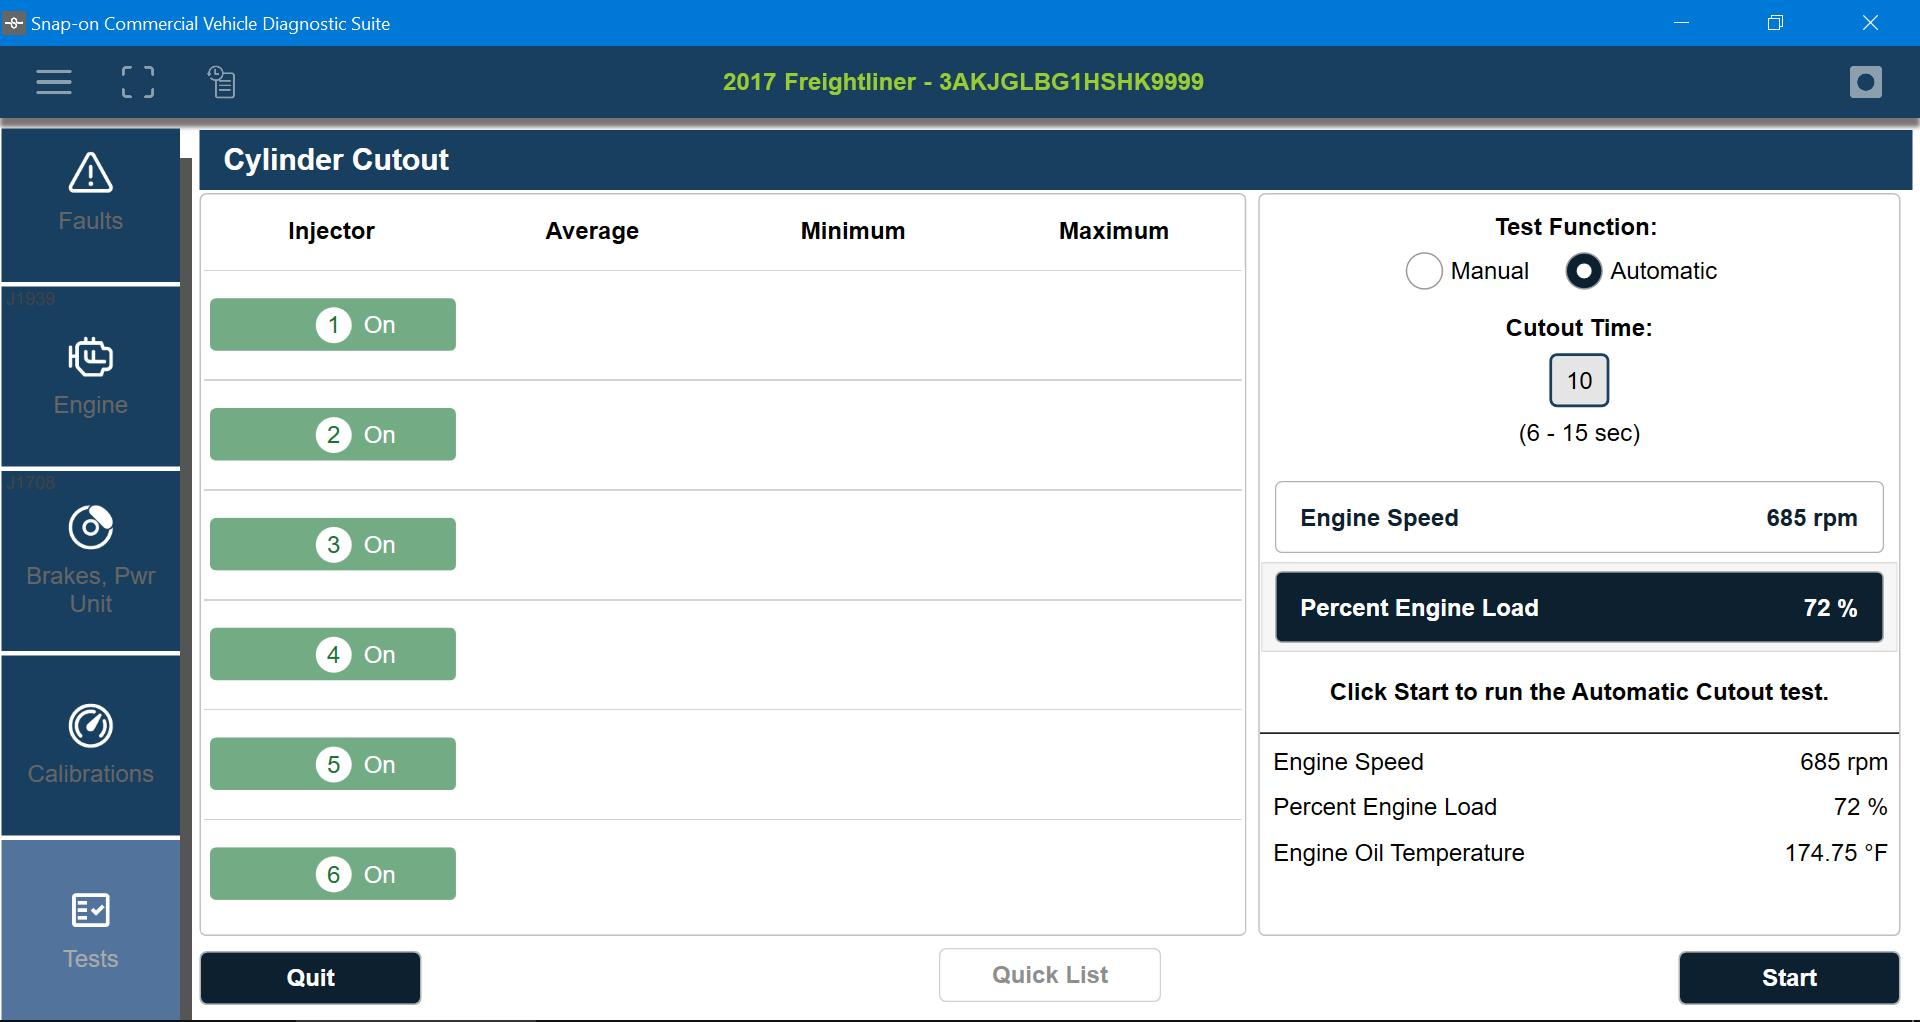
| 3. | Select the applicable button to start the test (e.g. Start, Run, OK ) |
| 4. | Follow all on-screen prompts to run the test. |
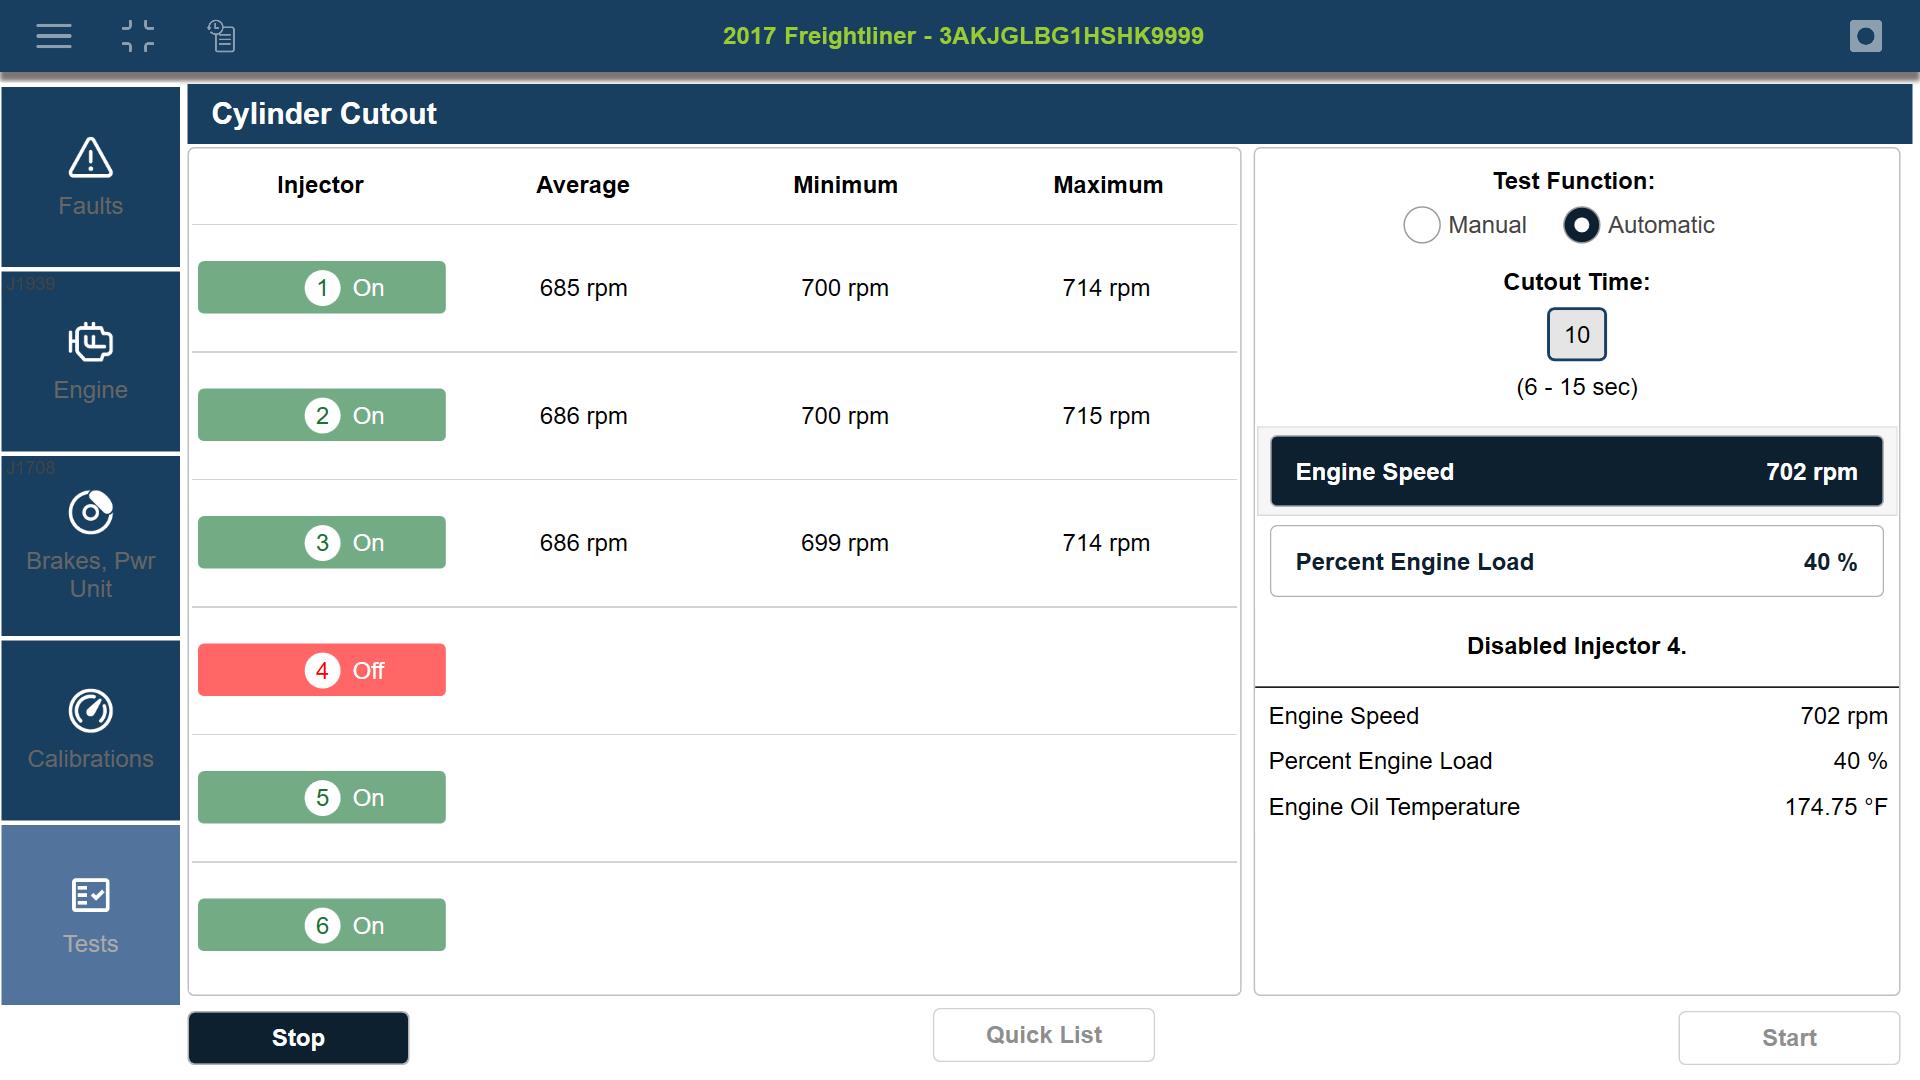
| 5. | Wait for the test to complete to view the results. |