Selecting Data or other similar data menu option (depending on the vehicle manufacturer) displays PID data for the selected system.
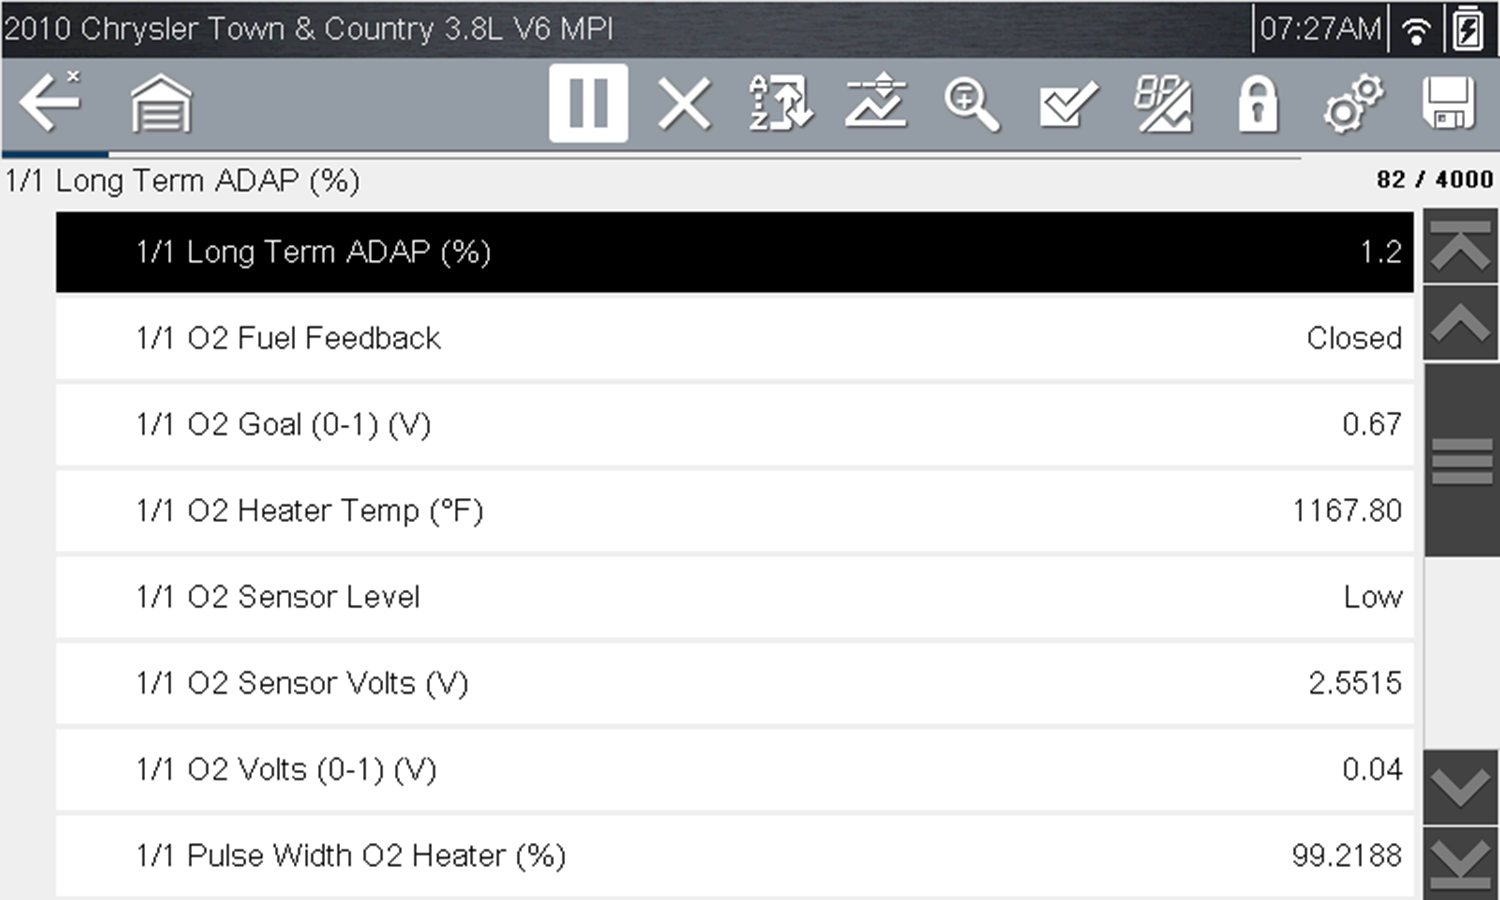
Data display (PID List view)
During data display the main body of the screen is divided into two columns; the left-hand column has a description of the parameter and the right-hand column shows the current parameter value or state. PIDs are listed in the order in which they are transmitted by the ECM, so variations between years, makes, and models will occur. The toolbar control icons are described in Icon Reference Table.
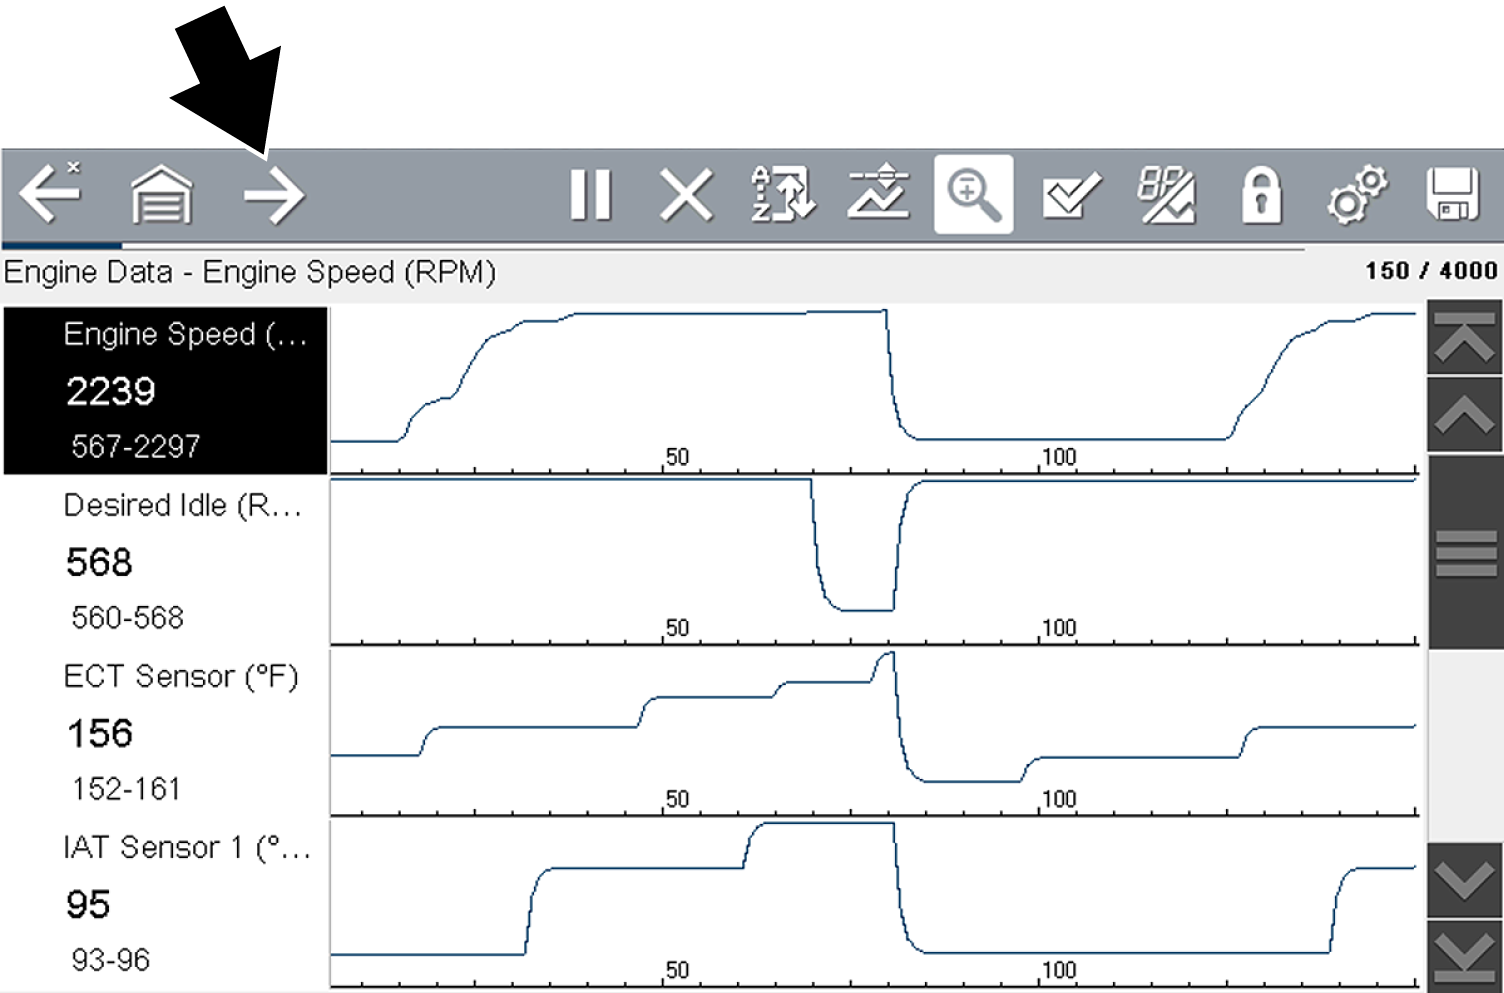
To display the next data list, select the Right Arrow icon.
The scanner toolbar contains control icons. Control icons may vary depending on the active function or test. An inverted (highlighted) icon indicates it is selected. Other control icons (not shown) are described in Icon Reference Table.
|
Icon |
Function |
Icon |
Function |
|
|
Start (Capture) - Resumes active data collection. |
|
Save - Writes data from buffer memory to a file. The saved “movie” file can be accessed for future reference by selecting Previous Vehicles and Data > View Saved Data. |
|
|
Pause - Pauses active data collection. |
|
Custom Data List - Opens a menu for selecting which PIDs display in the list. |
|
|
Clear - Erases all the PID data in the buffer and begins a new recording. Selecting opens a confirmation message. |
|
Change View - Changes display options between PID list or graph displays. |
|
|
Trigger - Opens a menu that allows you to set, arm, and clear threshold values that automatically trigger PID data to be saved from buffer memory to a file. |
|
Lock/Unlock - Locks or unlocks the highlighted parameter. Locked PIDs move to the top of the list and do not scroll as you move through the data. |
|
|
Zoom - Incrementally increases and decreases the scale of the data being displayed. |
|
Sort - Determines the order in which PIDs are listed on the screen. |
|
|
Step Forward - Allows forward movement in singular steps. |
|
Step Back - Allows backward movement in singular steps. |
|
|
Skip Forward - Allows forward movement in multiple steps. |
|
Skip Back - Allows backward movement in multiple steps. |


The diagnostic tool has the capability to collect, store and save PID data utilizing internal storage memory and buffer memory.
When Data is displayed onscreen, a data buffer automatically starts to store it in buffer memory. The data buffer runs continuously (storing data) until the Pause, Clear, or Save icon is selected.
Buffer memory is limited to a predetermined “total” size. When buffer memory reaches it’s full capacity, the data buffer will continue to store new data, however earlier stored data will be removed to allow room for the new data being stored.
The most recent data is always available for review when Pause is pressed, and can be reviewed using the toolbar controls.
The Data Buffer Indicator (figure - left arrow) can be used to visually see the amount of stored buffer data. This graphical indicator uses a bar graph to show how much stored data is in the memory buffer.
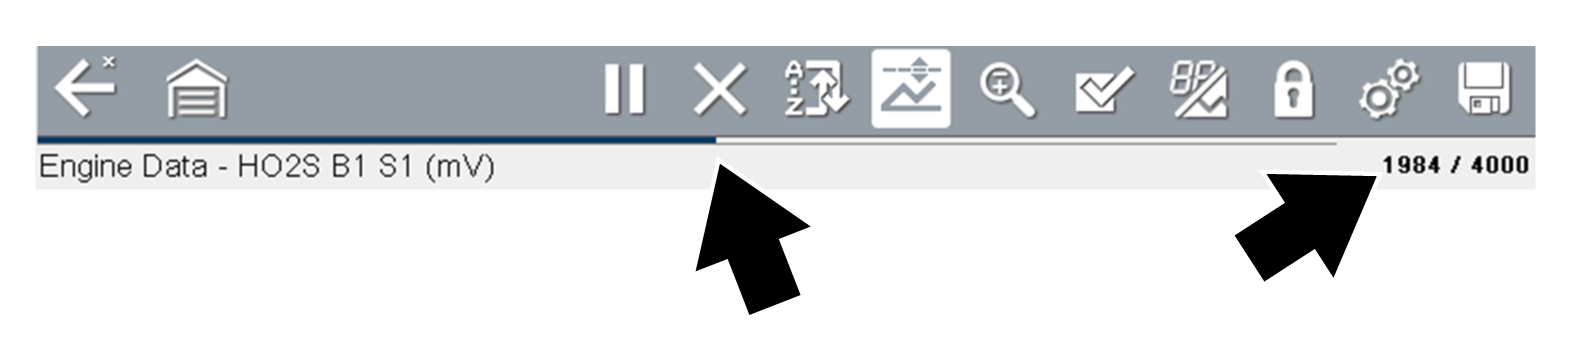
The Data Buffer Position Counter (right arrows in figure above and below) indicates:
| – | first value = the numerical position of the active data point as displayed within buffer memory |
| – | second value = indicates the maximum data buffer size value (e.g. 4000) |
(right arrows figure below) shows the relationship between the graph scale and the first value in the Position Counter.
During data review a slider on the bar graph (left arrow figure below), indicates the position of the current data point as displayed in relation to the entire memory buffer contents.


