|
Category |
FAQ's |
|||||||||||||||||||||||||||||||||||||||||||||||||||||||||||||||||||||||||||||||||||
|---|---|---|---|---|---|---|---|---|---|---|---|---|---|---|---|---|---|---|---|---|---|---|---|---|---|---|---|---|---|---|---|---|---|---|---|---|---|---|---|---|---|---|---|---|---|---|---|---|---|---|---|---|---|---|---|---|---|---|---|---|---|---|---|---|---|---|---|---|---|---|---|---|---|---|---|---|---|---|---|---|---|---|---|---|
| Getting Started |
See the Getting Started section in the ZEUS+ User Manual. |
|||||||||||||||||||||||||||||||||||||||||||||||||||||||||||||||||||||||||||||||||||
| Accessories |
To find accessories, contact your Snap-on representative and/or visit Diagnostic Tools and Accessories |
|||||||||||||||||||||||||||||||||||||||||||||||||||||||||||||||||||||||||||||||||||
| Accessories |
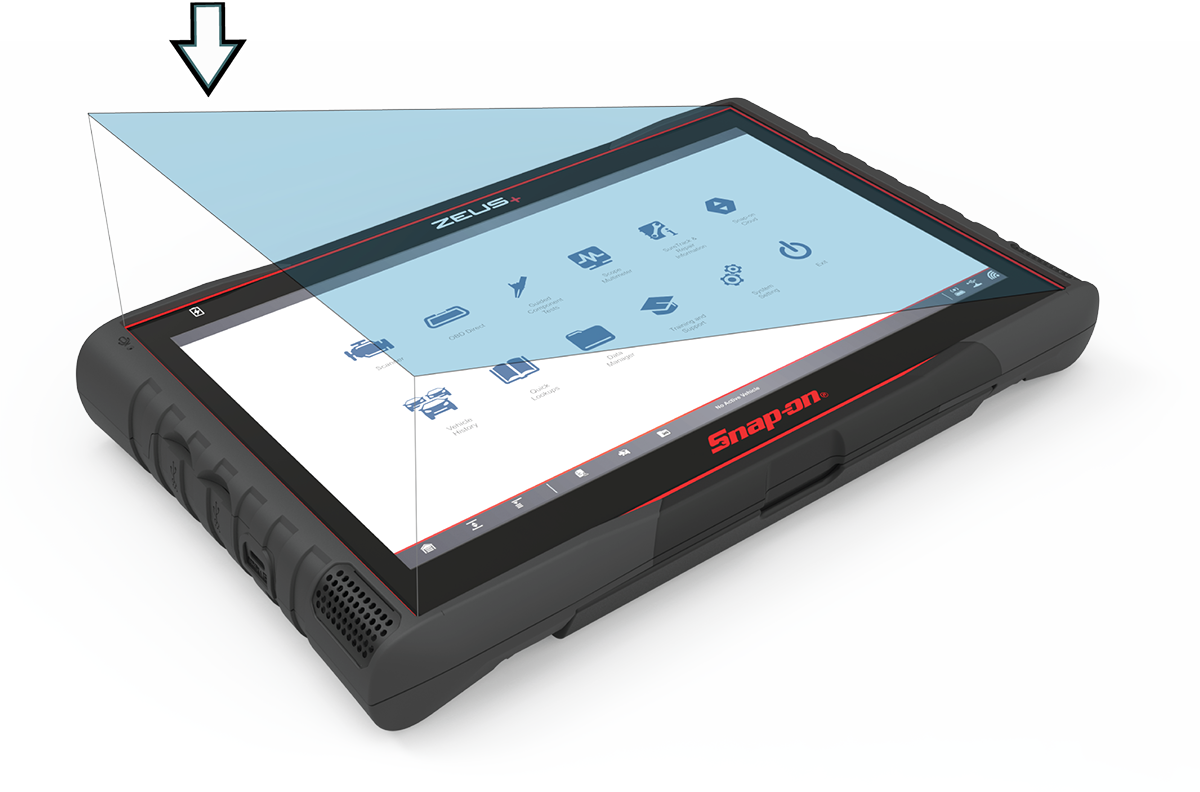
To find screen protectors, contact your Snap-on representative and/or visit Diagnostic Tools and Accessories NOTE - Screen protectors are not available for all models. Touch screen protectors are available as optional equipment (contact your sales representative to order). The following procedure describes typical installation procedures. Items recommended for installation:
To install a screen protector: Cleanliness is the most important factor during the installation of the screen protector. The following tips are provided to assist in the installation:
Minimize dust; work in an area with minimal air movement, turn off fans or air conditioning etc.
To remove air bubbles, slowly work from the inside towards the edges. If large air bubbles are trapped, it may be easier to carefully peel back the protector and re-apply. |
|||||||||||||||||||||||||||||||||||||||||||||||||||||||||||||||||||||||||||||||||||
| Accessories |
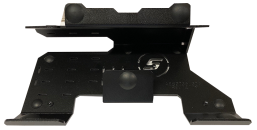
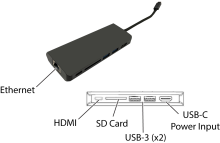
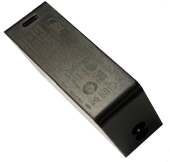
Visit your Snap-on website store, or contact your Snap-on representative, to purchase a ZEUS+ Device Stand with a USB-C Hub. The stand provides a quick way to set the diagnostic tool on a tool cart or bench. The stand is metal and has pre-drilled mounting holes. The USB-C Hub provides a convenient way to keep your diagnostic tool powered up all day, and extra connections for up to two USB devices and an HDMI video out connector to display the screen on an external monitor. Connections shown below.
|
|||||||||||||||||||||||||||||||||||||||||||||||||||||||||||||||||||||||||||||||||||
| Accessories |
Visit your Snap-on website store, or contact your Snap-on representative, to purchase a ZEUS+ USB-C Hub that provides a convenient way to keep your diagnostic tool powered up all day, and extra connections for up to two USB devices and an HDMI video out connector to display the screen on an external monitor. Connections shown below.
|
|||||||||||||||||||||||||||||||||||||||||||||||||||||||||||||||||||||||||||||||||||
| ADAS |
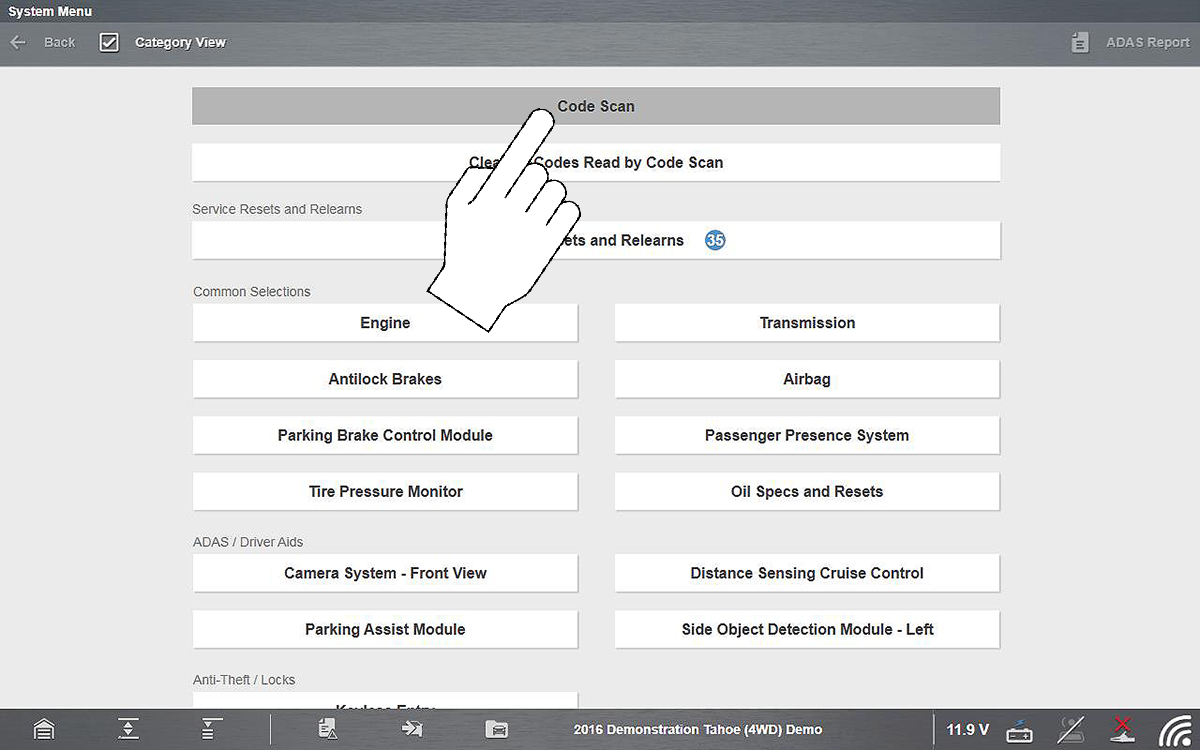
Most all ADAS recalibrations are performed using the Scanner function on your diagnostic tool. Select Scanner, then choose the applicable vehicle system and navigate to the desired function or test. NOTE - Some ADAS tests are displayed on top level menus, so be sure to scroll through the complete menu during navigation. Depending on the vehicle and recalibration test, special recalibration equipment may be required. For additional information about Snap-on ADAS recalibration equipment visit EZ-ADAS Hub. ADAS Recalibration Report Form Depending on the vehicle (if supported), an ADAS Recalibration Report form may be available after performing an ADAS recalibration test. The ADAS Recalibration Report form allows you to print the form with your shop information, the vehicle’s VIN, odometer and license plate information. The recalibration information is manually entered after the form is printed. When an ADAS report is generated, press the SAVE icon to automatically uploaded it to the From the Cloud you can print or share the report. EZ-ADAS Recalibration instructions and user guides are integrated within the Mobile APP and website at EZ-ADAS Hub Important notes about ADAS and diagnostic tools: Supported ADAS recalibrations and tests vary by vehicle make/model. Before performing any ADAS recalibraiton always make sure: You have the vehicle identified correctly You are using the correct special equipment as applicable to the specific vehicle You follow all instructions and safety precautions as specified |
|||||||||||||||||||||||||||||||||||||||||||||||||||||||||||||||||||||||||||||||||||
| Battery / Device Power |
The diagnostic tool will operate without the battery installed, however it is not advisable to operate without a charged battery installed. |
|||||||||||||||||||||||||||||||||||||||||||||||||||||||||||||||||||||||||||||||||||
| Battery / Device Power |
Battery charging occurs whenever the AC power supply is connected to a live power source and the diagnostic tool. |
|||||||||||||||||||||||||||||||||||||||||||||||||||||||||||||||||||||||||||||||||||
| Battery / Device Power |
For more information, contact your Snap-on representative and/or visit Diagnostic Tools and Accessories Only use the manufacturer recommended original equipment replacement battery pack. |
|||||||||||||||||||||||||||||||||||||||||||||||||||||||||||||||||||||||||||||||||||
| Battery / Device Power |
The diagnostic tool (display unit) comes equipped with a rechargeable internal battery pack that can be charged using the supplied AC power adapter. A fully charged battery pack provides sufficient power for up to 9 hours of continuous operation. Use the supplied AC power adapter to charge the battery pack. Connect the USB-C cable end of the power adapter into the USB-C jack on the side of the diagnostic tool, then connect the power adapter to an approved AC power source. Only use the supplied AC power adapter. Never connect the power adapter to the diagnostic tool when the tool is communicating with a vehicle. Battery Status Indicator The battery status LED indicator is located at the top left of the screen. This indicator displays battery status and charge level.. Three colors are used to show battery level and power status:
|
|||||||||||||||||||||||||||||||||||||||||||||||||||||||||||||||||||||||||||||||||||
| Battery / Device Power |
Make sure you are using a known good power source, and then try the following:
If you are still experiencing difficulties, contact customer support Phone
|
|||||||||||||||||||||||||||||||||||||||||||||||||||||||||||||||||||||||||||||||||||
| Battery / Device Power |
The following process can be used to “recondition” the battery pack Depending how many “valid” recharge cycles the battery has previously gone through, it should be approximately between 80% and 100% of its original capacity once reconditioned.
|
|||||||||||||||||||||||||||||||||||||||||||||||||||||||||||||||||||||||||||||||||||
| Battery / Device Power |
ZEUS+®
|
|||||||||||||||||||||||||||||||||||||||||||||||||||||||||||||||||||||||||||||||||||
| Component Testing |
= Home Screen > Guided Component Tests Detailed instructions and reference information are provided to guide you through the testing process, from locating the component, to selecting the appropriate test, showing test lead connections, and illustrating electrical connector and pin configurations. In addition, the test meter is preconfigured for the selected test to save you time. Test results, including waveform examples, procedures, tips, and specifications may also be provided. |
|||||||||||||||||||||||||||||||||||||||||||||||||||||||||||||||||||||||||||||||||||
| Component Testing | ||||||||||||||||||||||||||||||||||||||||||||||||||||||||||||||||||||||||||||||||||||
| Vehicle Data Connection |
When troubleshooting CSM connectivity issues, first review the CSM LED status and hardware status icons for possible causes. Make sure the scan module is powered, paired and able to communicate. CSM operations can be impacted when signal interference, or some other condition, disrupts or impairs the wireless communication network. For additional information on LED indicators and troubleshooting , see the Compact Scan Module section in the user manual. |
|||||||||||||||||||||||||||||||||||||||||||||||||||||||||||||||||||||||||||||||||||
| Vehicle Data Connection |
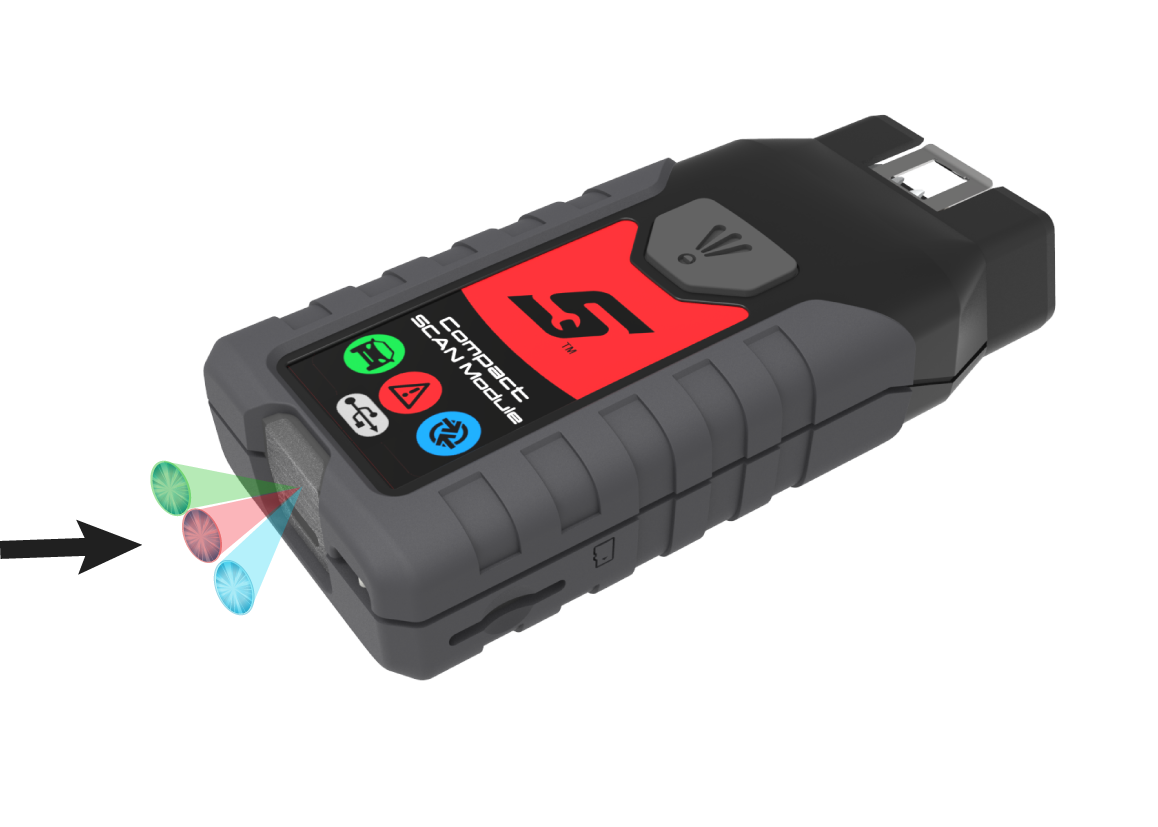
The CSM and diagnostic tool must be on when pairing the CSM. Make sure the diagnostic tool has a fully charged battery, or is connected (recommended) to the AC power supply.
The green LED on the CSM is illuminated when power is being supplied to the CSM by a vehicle DLC. The blue LED is illuminated when power is being supplied by USB connection.
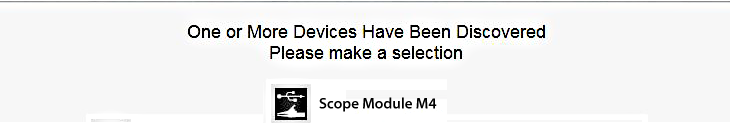
The diagnostic tool searches for compatible wireless devices, then displays the results.
Search results include all compatible wireless devices detected, and may include multiple Scan Modules if you are in a shop environment where more than one unit is powered on. Available module listings include a partial serial number. Make sure the screen listing matches the last six digits of the serial number of your CSM before continuing.
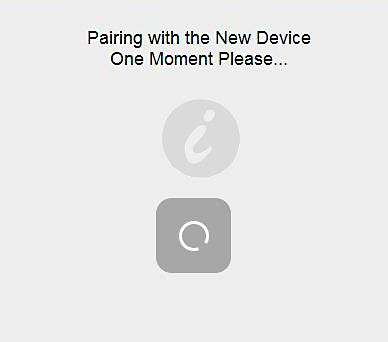
A progress message displays during the pairing procedure, the Paired Devices screen displays once the procedure completes.
If a CSM firmware update is available, the CSM will automatically be updated. When pairing is successful the CSM hardware status indicator displays on the Home screen (lower-right corner), providing a quick reference to connection status.
|
|||||||||||||||||||||||||||||||||||||||||||||||||||||||||||||||||||||||||||||||||||
| Vehicle Data Connection |
Light emitting diodes (LEDs) on the CSM indicate communication status. The following LED descriptions apply only when the CSM is powered by the vehicle DLC (unless otherwise noted).
LED indicator descriptions:
In addition to onscreen messages, the CSM uses audible tones to alert you of connection status. Alerts include:
If other alerts occur (series of “beeps”) this may indicate a communication error. Follow the onscreen instructions, to identify and resolve the issue. |
|||||||||||||||||||||||||||||||||||||||||||||||||||||||||||||||||||||||||||||||||||
| Vehicle Data Connection |
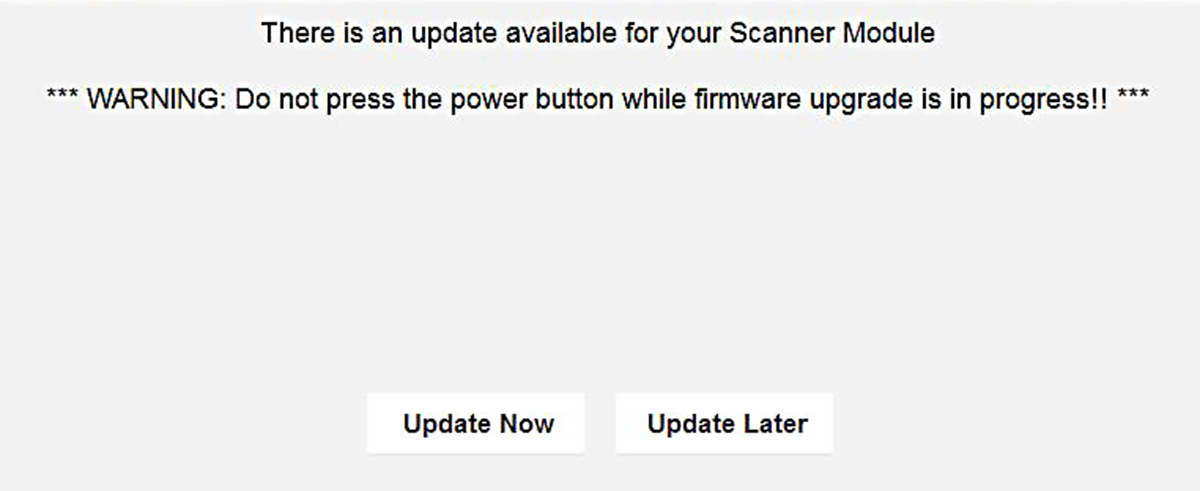
The internal programming (firmware) of the CSM may require periodic updates. Firmware updates increase the CSMs diagnostic capabilities; typically by adding support for new tests, vehicles, and enhanced applications to the vehicle databases. CSM firmware updates (when available) are delivered with diagnostic software updates/upgrades. Upon starting the Scanner function, initially after a software update or upgrade has been installed, a message may be displayed to inform you an update is available. When performing a firmware update it is recommended to disconnect the CSM from the vehicle (if connected) and use the supplied USB cable to connect the CSM to the diagnostic tool.
Firmware update message The firmware update process, as explained in the following procedure, begins automatically after ten seconds (only when connected by USB) unless Update Now or Update Later is selected. Selecting Update Now begins the process immediately. Update Later defers the operation, closes the message, and starts the Scanner function. If you choose not to perform the update, it will not affect diagnostic tool operation, however you will not benefit from the additional features available in the update. Selecting Details in the upper-right corner opens a list of what is included in the update. Updating CSM Firmware The diagnostic tool must be connected and powered by the AC power supply during the CSM firmware update process. Damage can occur to the CSM if the diagnostic tool power is turned off, the power supply is disconnected, or the diagnostic tool looses communication (out of range) with the CSM during the firmware update process.
When performing a firmware update it is recommended to disconnect the CSM from the vehicle (if connected) and use the supplied USB cable to connect the CSM to the diagnostic tool. Using the USB cable provides power direct from the diagnostic tool to the CSM, and allows for faster updates. Leaving the CSM connected to the vehicle DLC during a firmware update will work, however may take longer than if connected by USB. Also, if vehicle power to the DLC is interrupted, of the diagnostic tool looses communication with the CSM, the CSM may not update correctly and/or be damaged.
When connected, the CSM USB connection status icon will change to indicate the CSM is connected by USB.
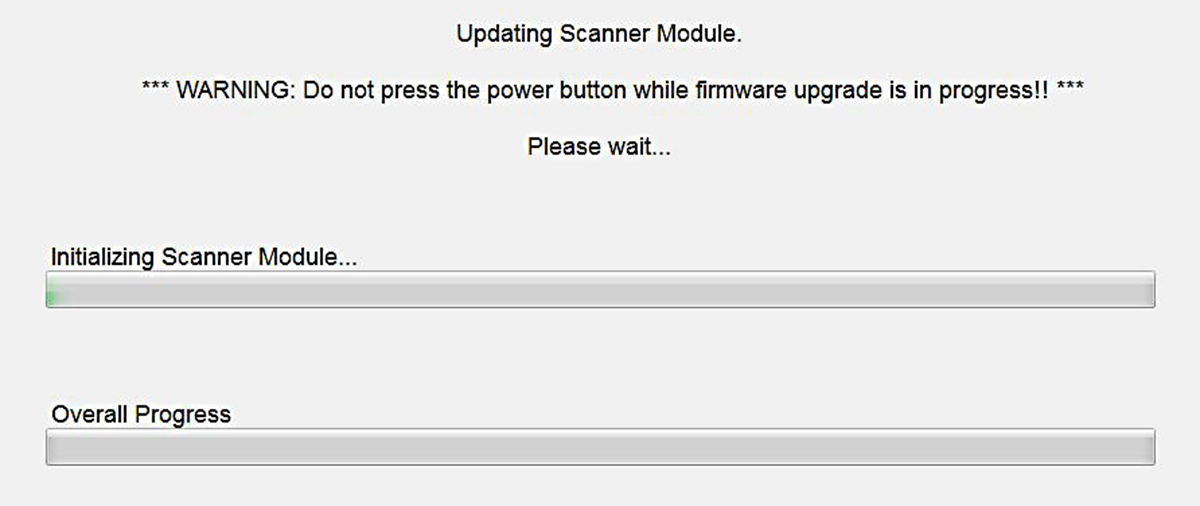
The update begins and installation progress is tracked on the screen.
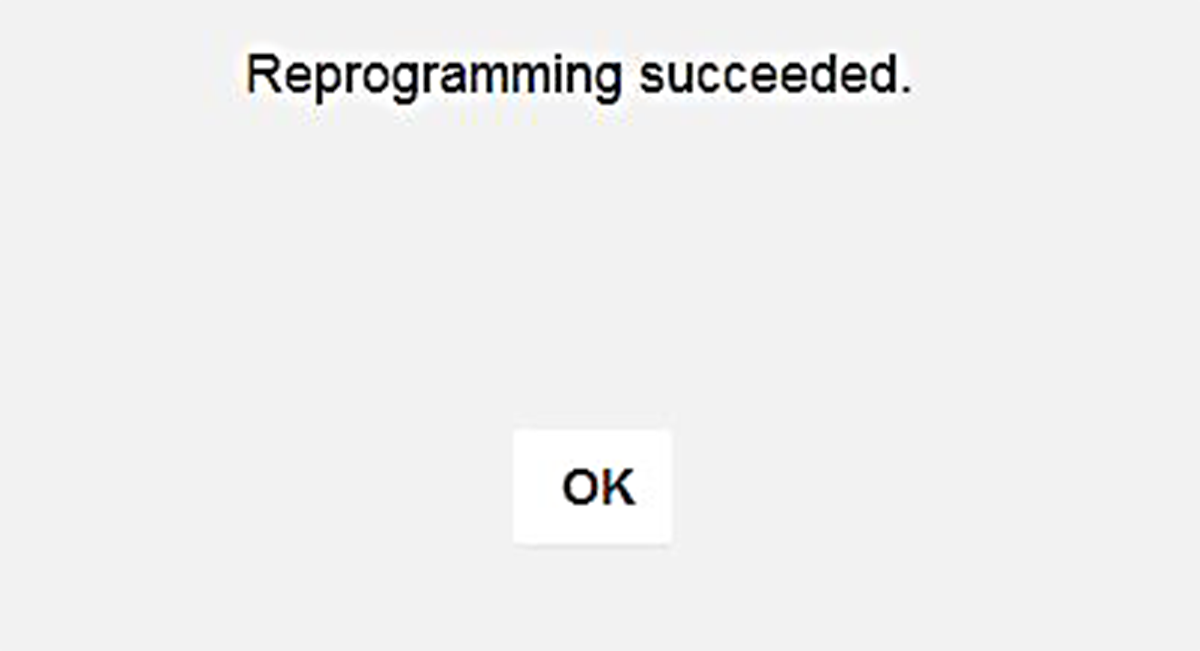
Sample update in progress screen A “Successfully Updated” message displays once the installation process is complete .
Sample firmware update complete message
The CSM, now has the latest firmware update, and is ready to use. |
|||||||||||||||||||||||||||||||||||||||||||||||||||||||||||||||||||||||||||||||||||
| Vehicle Data Connection |
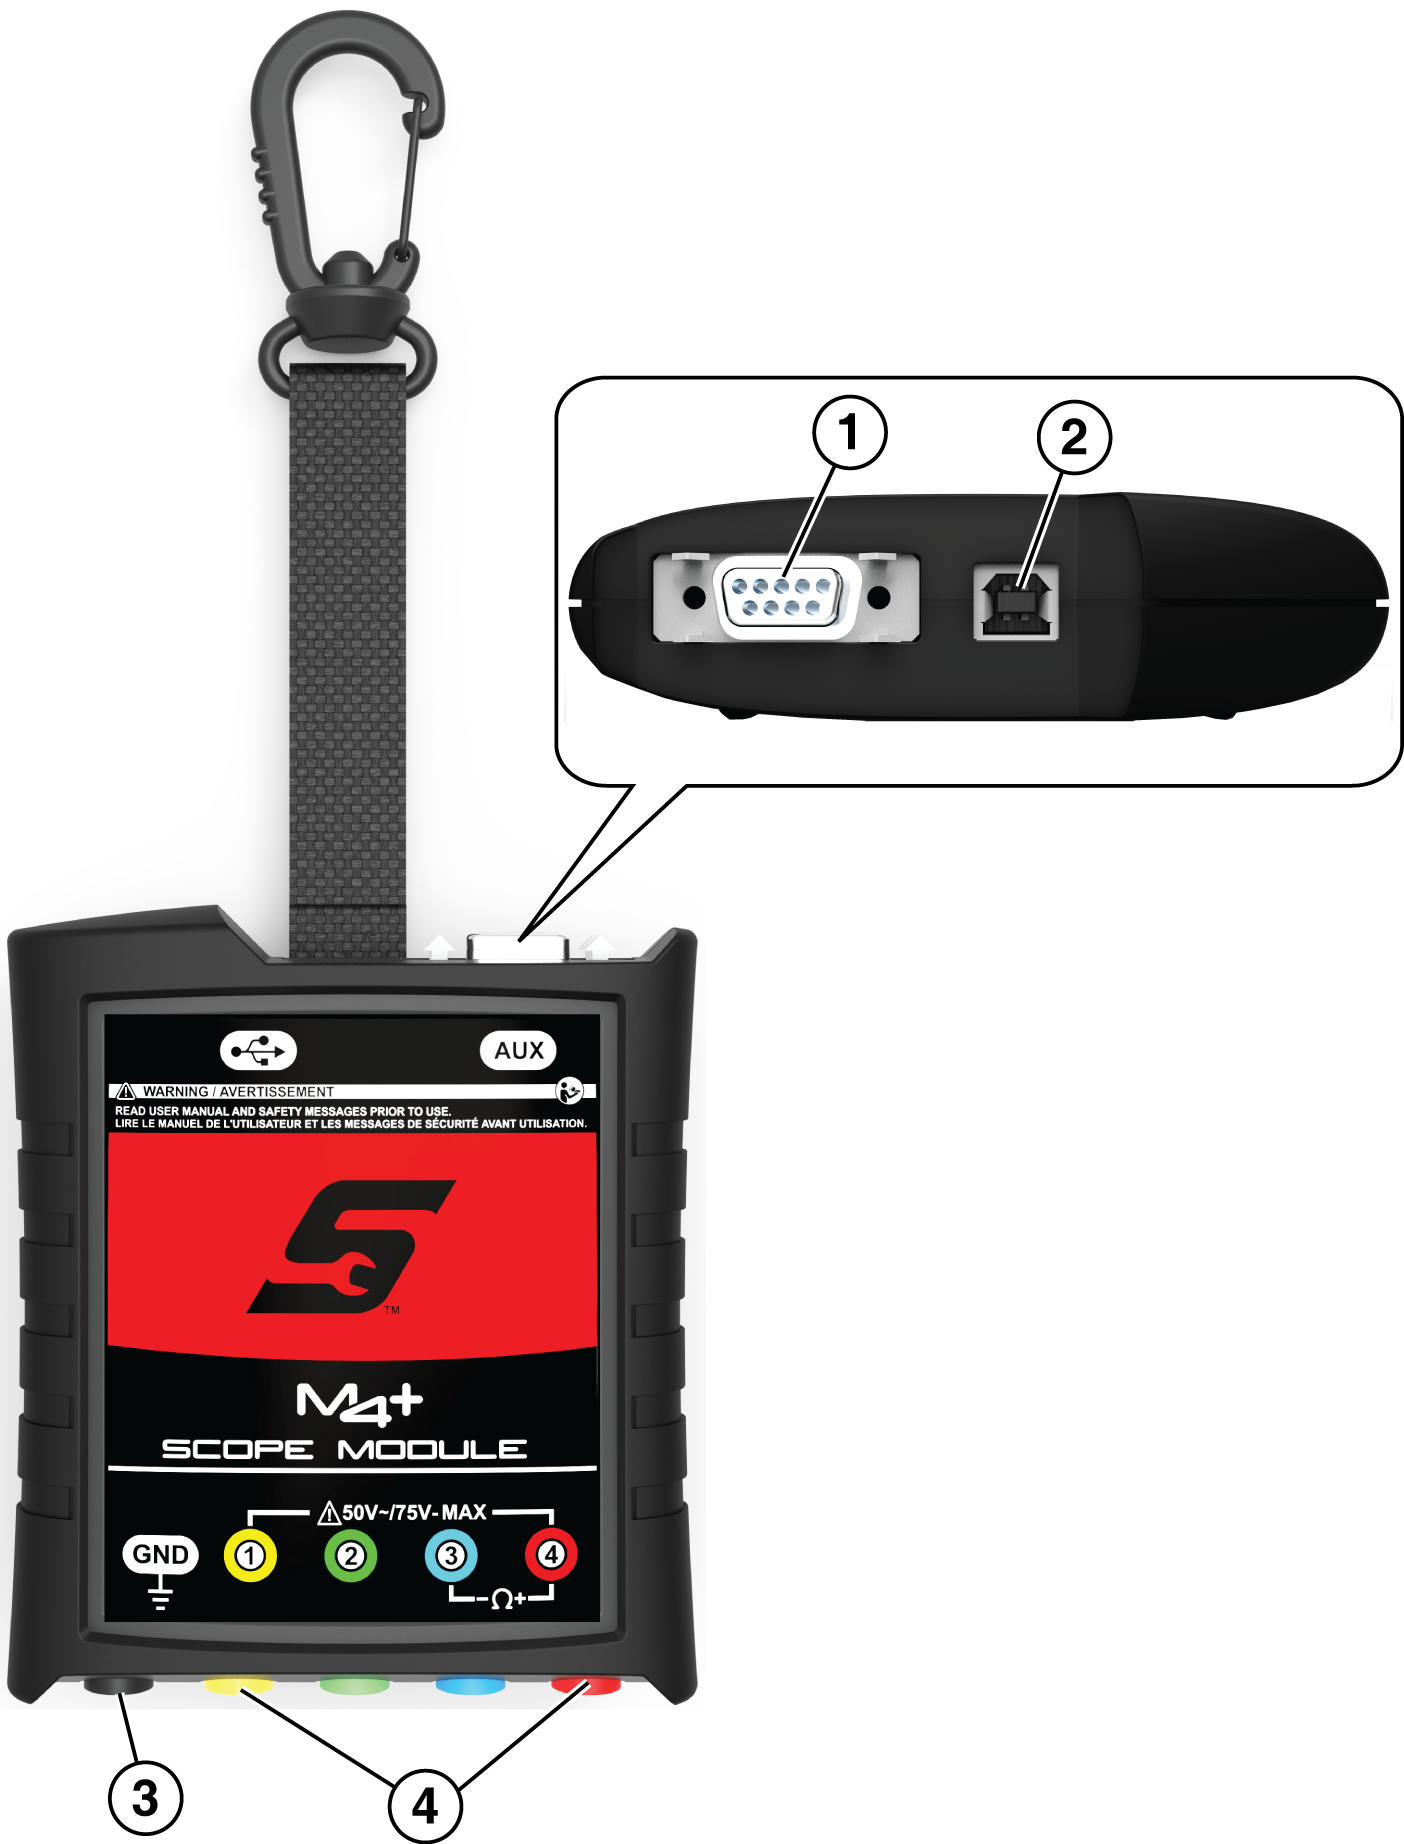
The USB jack on the CSM is only used to provide power to the CSM from the diagnostic tool during a CSM firmware update. The USB jack is not for vehicle communication. |
|||||||||||||||||||||||||||||||||||||||||||||||||||||||||||||||||||||||||||||||||||
| Vehicle Data Connection |
Ethernet equipped vehicles use the standard 16 pin OBD-II diagnostic link connector (DLC) for diagnostic tool connection, however the diagnostic tool and/or compact scan module (CSM) must be designed to support Ethernet communication. Click here for additional information. (opens new tab) |
|||||||||||||||||||||||||||||||||||||||||||||||||||||||||||||||||||||||||||||||||||
| Vehicle Data Connection |
Depending on your tool and the vehicle, you may be able to use the OBD-I European Vehicle Cable Adapter Kit. Contact your Snap-on representative for information. |
|||||||||||||||||||||||||||||||||||||||||||||||||||||||||||||||||||||||||||||||||||
| Device Features |
Depending on your device, market and subscription, information services will vary and /or not be available. Performance varies depending on your wireless network equipment and ISP. The following integrated information services provide up-to-date service/repair information directly to your diagnostic tool, via wireless network connection from our Snap-on Web Services Network:
If your access to these services has expired, or you have received messages about upcoming software upgrades or pending expiration, contact your sales representative. |
|||||||||||||||||||||||||||||||||||||||||||||||||||||||||||||||||||||||||||||||||||
| Device Features |
|
|||||||||||||||||||||||||||||||||||||||||||||||||||||||||||||||||||||||||||||||||||
| Device Features |
The view finder now shows the captured picture.
For additional information , see the Camera section in the user manual. |
|||||||||||||||||||||||||||||||||||||||||||||||||||||||||||||||||||||||||||||||||||
| Device Serial Number |
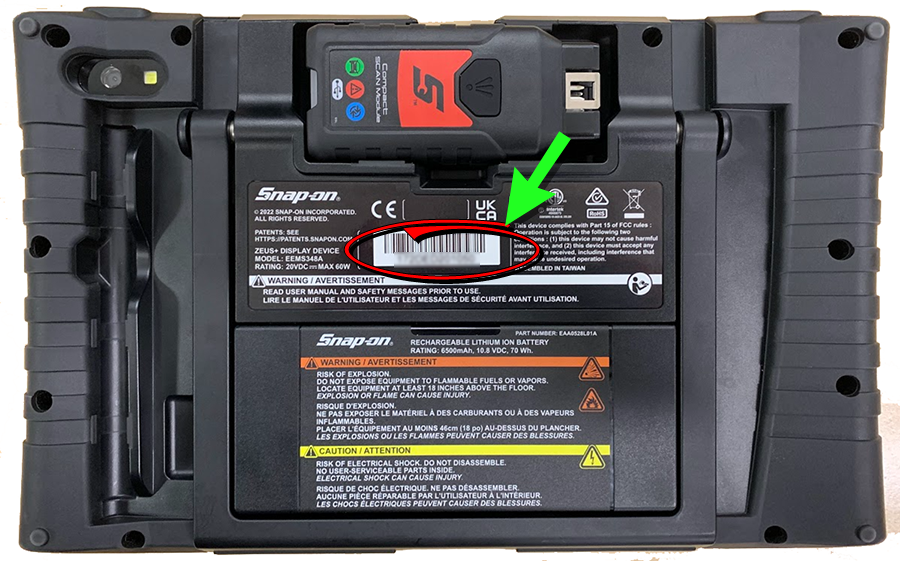
The diagnostic tool serial number is displayed on the Get Connected screen. Typical Navigation = Home Screen > System Settings > Get Connected The diagnostic tool serial number is also located on the back of the diagnostic tool housing. |
|||||||||||||||||||||||||||||||||||||||||||||||||||||||||||||||||||||||||||||||||||
| Device Settings |
= "S" Button > Brightness Click the "S" button then select the Brightness setting to adjust the brightness of the display. Use multiple taps to toggle though the brightness level settings. |
|||||||||||||||||||||||||||||||||||||||||||||||||||||||||||||||||||||||||||||||||||
| Device Settings |
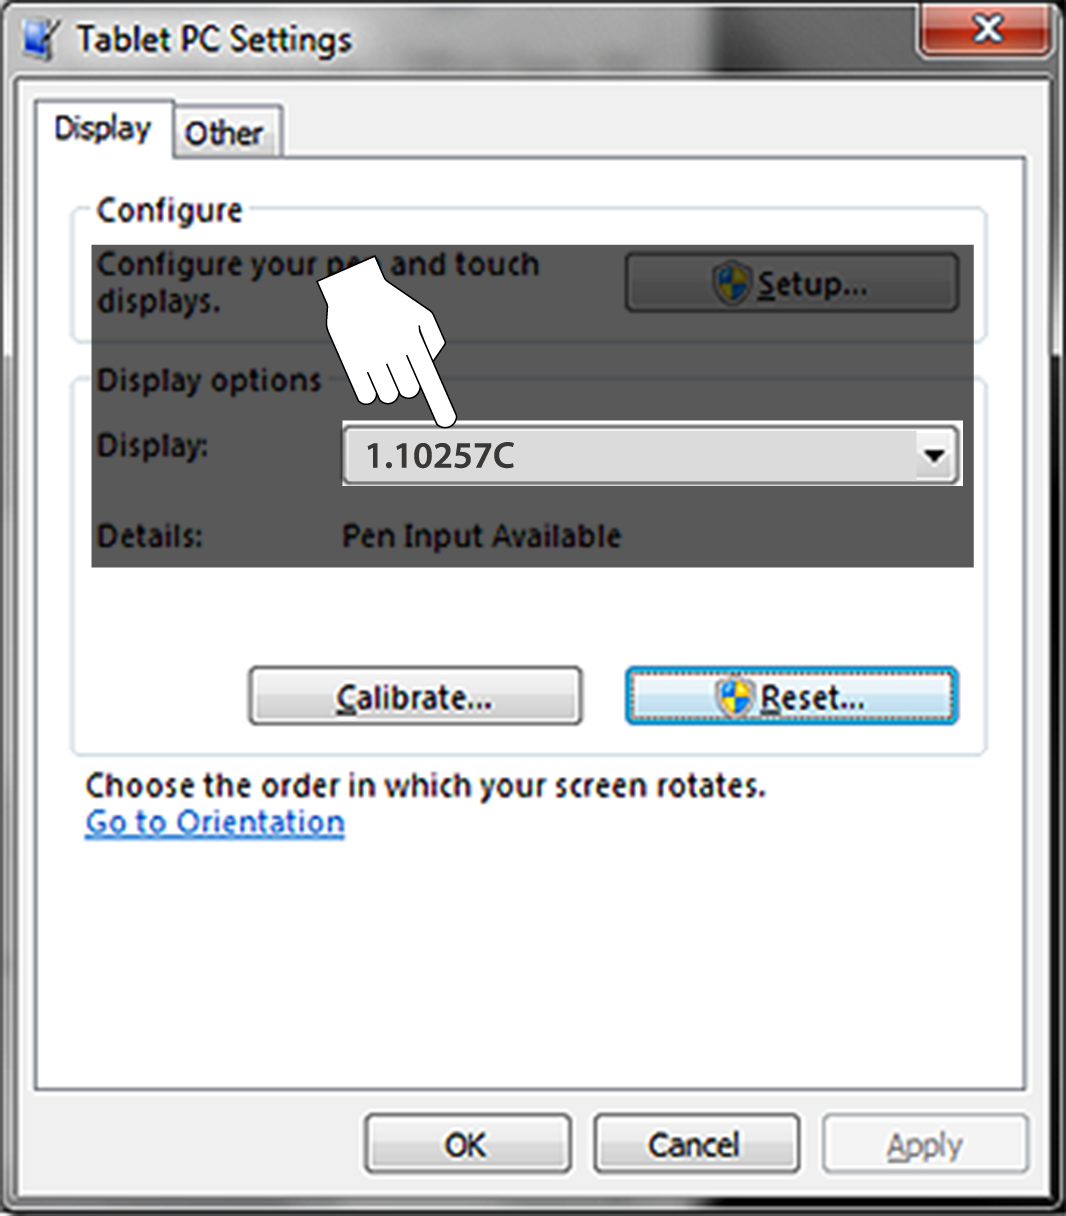
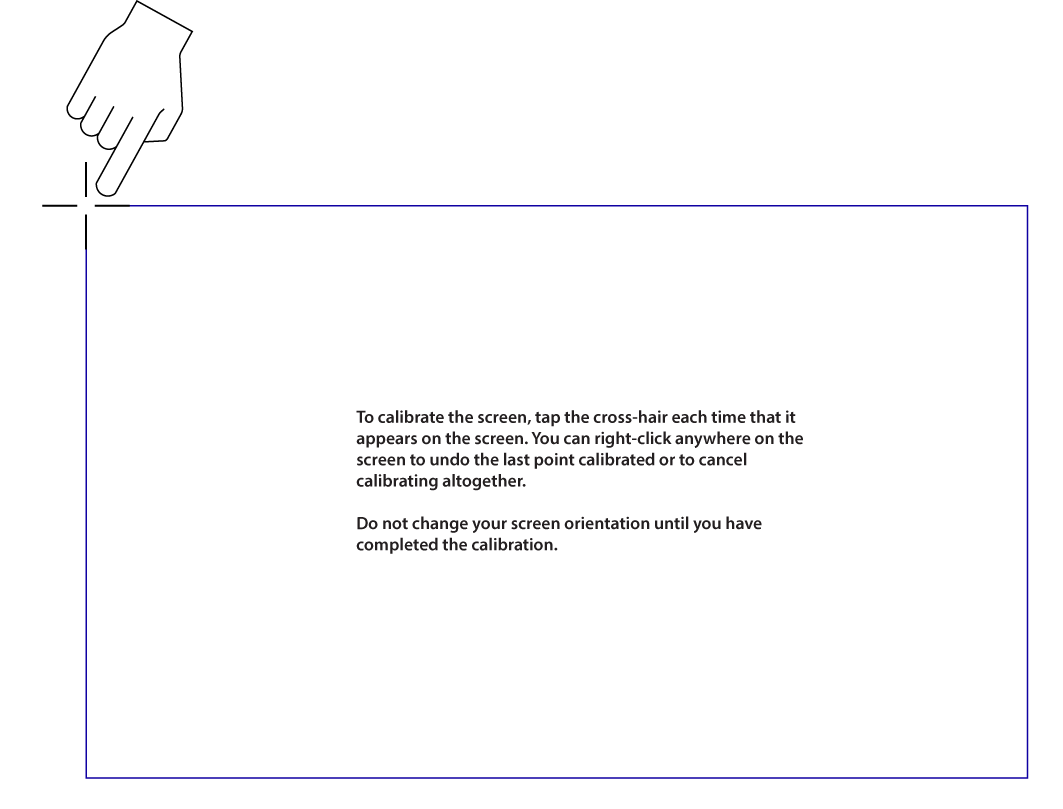
The touch screen can be calibrated for accuracy using the Windows Tablet PC Settings. To calibrate the touch screen:
The Tablet PC Setting window is displayed .
If you are using an optional touch screen (e.g. using an external touch screen with a Tech Cart and docking station), there will be an additional touch screen choice displayed.
The Calibration screen is displayed .
To achieve the best results, it is recommended to use the capacitive stylus when performing the touch screen calibration.
Calibrating the Touch Screen
|
|||||||||||||||||||||||||||||||||||||||||||||||||||||||||||||||||||||||||||||||||||
| Device Settings |
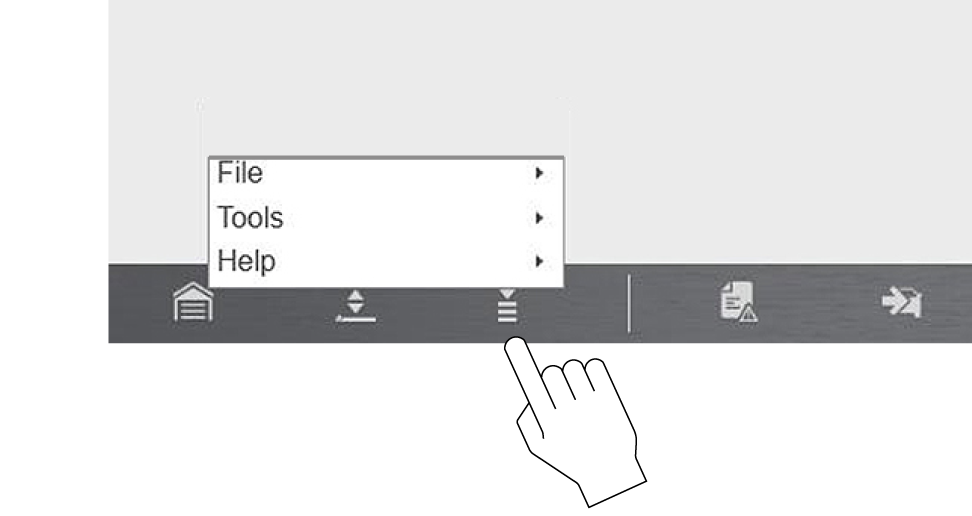
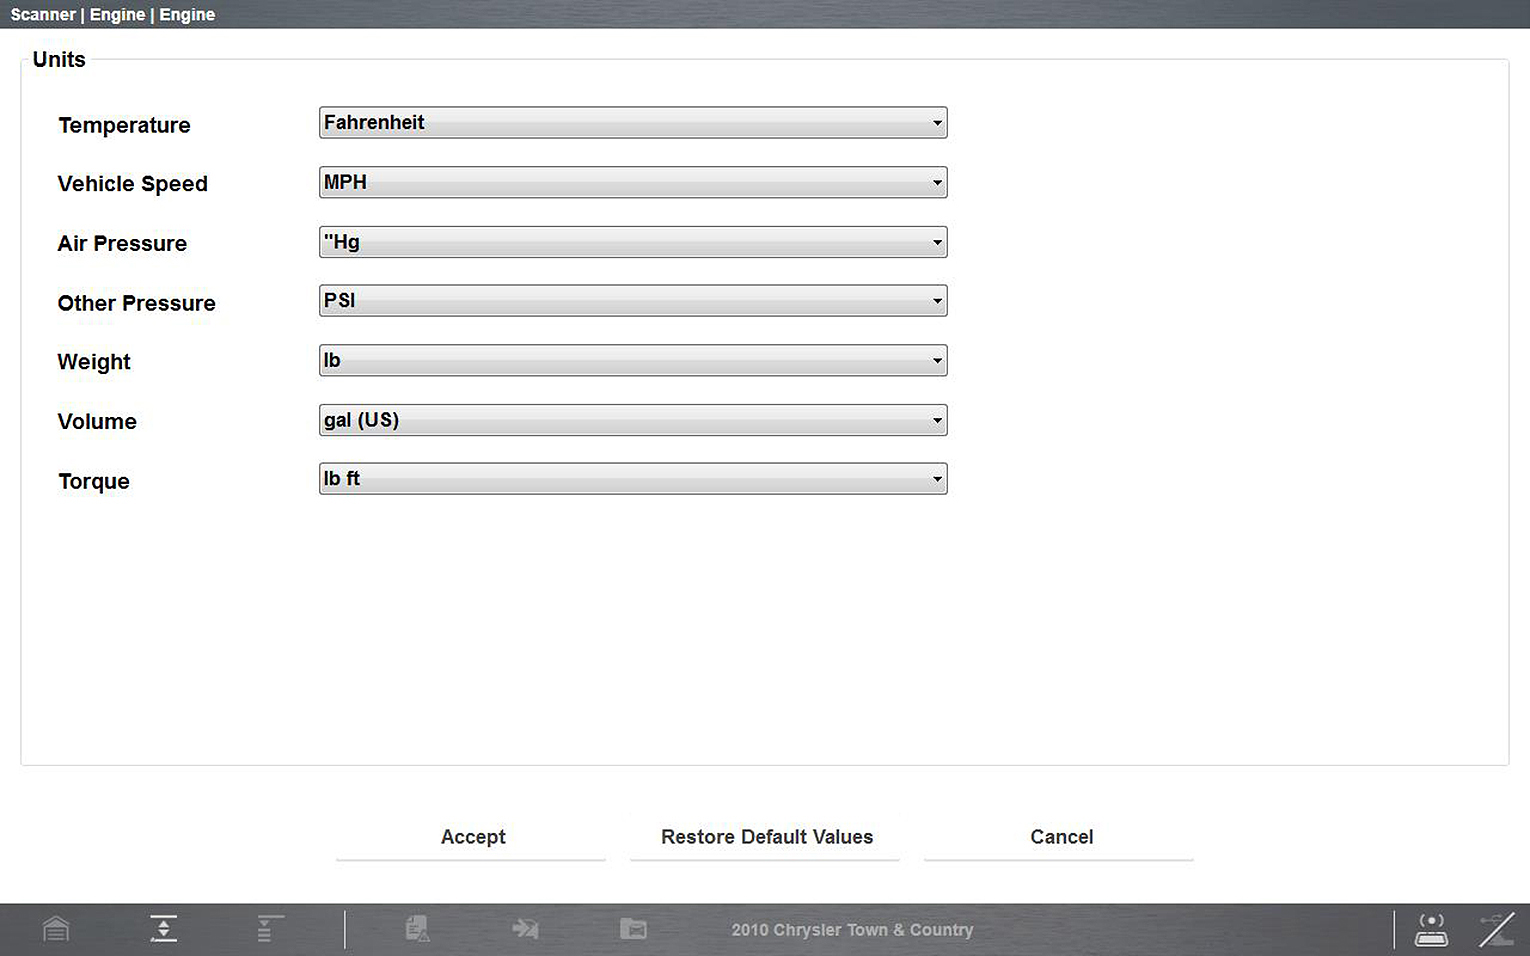
The Diagnostic Suite units of measurement can be changed for temperature, vehicle speed, air pressure and other pressure readings. Choose between US customary or metric units of measure.
The Units setup dialog box opens.
|
|||||||||||||||||||||||||||||||||||||||||||||||||||||||||||||||||||||||||||||||||||
| Device Settings |
Click on the date and time display in the taskbar (lower right of windows desktop screen) to open the settings window. |
|||||||||||||||||||||||||||||||||||||||||||||||||||||||||||||||||||||||||||||||||||
| Device Settings | ||||||||||||||||||||||||||||||||||||||||||||||||||||||||||||||||||||||||||||||||||||
| Device Settings |
The Shortcut (S) button Options may vary:
|
|||||||||||||||||||||||||||||||||||||||||||||||||||||||||||||||||||||||||||||||||||
| Maintenance |
Periodically perform the following tasks to keep your diagnostic tool in proper working order:
Do not use any abrasive cleansers or automotive chemicals on the diagnostic tool. Cleaning the Touch Screen The touch screen can be cleaned with a soft cloth and a mild window cleaner. Do not use any abrasive cleansers or automotive chemicals on the touch screen. Cleaning the Compact Scan Module (CSM) When using the CSM, always:
Do not use any abrasive cleansers or automotive chemicals on the CSM. |
|||||||||||||||||||||||||||||||||||||||||||||||||||||||||||||||||||||||||||||||||||
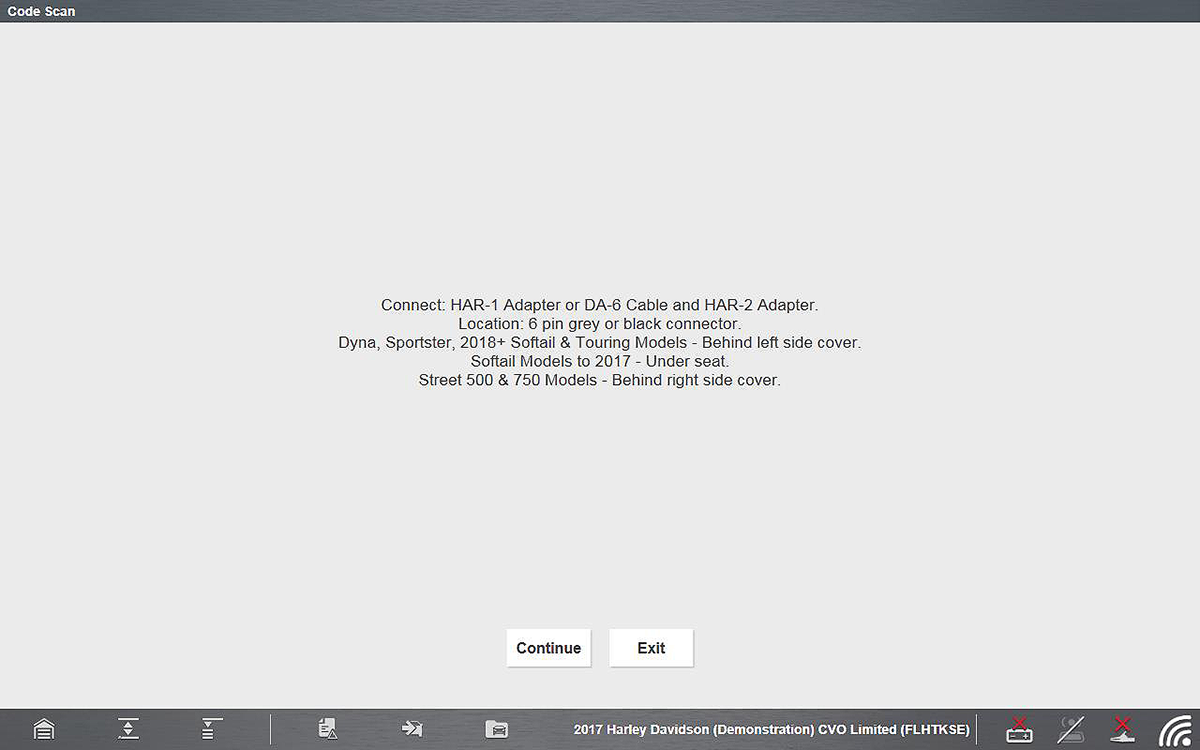
| Motorcycle Scanning |
This feature is not applicable to all tools.
Depending on the motorcycle, the identification process may require manual entry of the motorcycle information, or it may be automated
Ensure the LEDs on the SVI and data cables are on when establishing communication between the motorcycle and diagnostic tool.
For additional information, see the Motorcycle section under Scanner in the user manual. |
|||||||||||||||||||||||||||||||||||||||||||||||||||||||||||||||||||||||||||||||||||
| OBD-II/EOBD Operations |
The OBD-II/EOBD function can be useful in a situation where the vehicle is not recognized or is an OBD-II compliant vehicle that is not supported by the enhanced scanner software, as you can still access “global” OBD-II/EOBD codes and data. You can also use it to:
|
|||||||||||||||||||||||||||||||||||||||||||||||||||||||||||||||||||||||||||||||||||
| OBD-II/EOBD Operations |
Using the OBD-II/EOBD Health Check function, you can quickly check / clear emissions-related diagnostic trouble codes (DTCs), and check readiness monitors for emissions testing. = Home Screen > OBD Direct > OBD Health Check |
|||||||||||||||||||||||||||||||||||||||||||||||||||||||||||||||||||||||||||||||||||
| OBD-II/EOBD Operations |
OBD-II (On-Board Diagnostics) provides a standardize “global” way to communicate with vehicle control modules/systems in order to check emission related components/systems for compliance. On-Board Diagnostics is basically the integrated “diagnostic” programming of the engine management system that monitors electrical sensors/components that influence exhaust emissions. OBD-II Service Modes (or services) provide the standardized emissions related data, test results and services that the engine management system monitors and are available without the use of a specialized diagnostic tool. There are basically ten basic modes / services. Brief descriptions are provided below. = Home Screen > OBD Direct > OBD Diagnose > Start Communication Use this mode to view the current powertrain PIDs. This data is displayed unmodified as transmitted by the module(s). The main body of the screen has two columns; the left-hand column is a description of the PID and the right-hand column is the value or state. Viewing options and operations are the same as the Scanner function. Create a custom PID list to increase the display refresh rate / response time of displayed PIDs. Freeze frame data provides a “snapshot” of critical PIDs at the approximate time the DTC was set. This mode is used to display freeze fame data for any stored emission related diagnostic trouble codes (DTCs). In most cases the stored frame is the last DTC that occurred. Certain DTCs, those that have a greater impact on vehicle emissions, have a higher priority. In these cases, the highest priority DTC is the one for which the freeze frame records are retained. This mode displays stored emission related DTCs. The display is similar to the Scanner function code display. The list does not include enhanced DTCs. This mode is used to clear all emission related diagnostic data, such as DTCs, freeze frame data, and monitor test results This also resets monitors to Not Ready and turns the MIL off. This option opens a submenu of services for to display parameters and test results from various sensors, monitor test results, and a record of DTC setting conditions detected during the last drive cycle. The submenu includes: ($05) Oxygen Sensor Monitoring This option provides test results for checking the integrity of the oxygen (O2) sensors for non-CAN Bus vehicles. Making a selection displays all of the pertinent O2 sensor parameters for the specific test. The test identification (ID) displays at the top of the data list. Typically this mode will not be available when testing a CAN Bus equipped vehicle, as the applicable data is provided in mode six. ($06) On-board Monitored Systems This mode provides monitored system test results. The available data is for specific systems and components that the on-board diagnostic system monitors continuously, such as misfire, or non‑continuously, such as the catalyst system. Mode $06 information may vary between make/model/year and may require information from the OEM in order to interpret the results. To find OEM mode 6 information, check the OEM service information. As an alternate source visit NASTF.org For CAN Bus equipped vehicles, OEMs typically define the different test results using Monitor ID's (MID) numbers (e.g MID $39, $A2), and Component IDs (CID). Each MID and CID may provide test result values and fault limits that can help you identify which monitor has failed and help validate the repair after completion. For pre-CAN Bus equipped vehicles, OEMs typically defined the different test results using Test ID (TID) and Component IDs (CID). These were used in the same manner as described above for CAN Bus vehicles. ($07) DTCs Detected During Last Drive This mode is also commonly known as "Pending Codes". Mode seven provides a record of pending DTCs that set during the last completed drive cycle. Pending DTCs are also referred to as "two-trip" codes, where at the initial malfunction the module stores the code, but does not activate the MIL. Only if the same malfunction happens again will the MIL activate and the code be stored in the mode three list. This can be helpful when verifying a repair, by checking the results after a drive cycle. This mode provides bidirectional control of applicable emissions related components. When supported, this typically allows the diagnostic tool to control the operation of the EVAP vent and purge solenoids. This mode provides vehicle-specific information from the applicable emission related modules, such as the vehicle identification number (VIN), and module calibration, verification numbers (CVN). Select a menu item to retrieve the information. This information can be helpful when reprogramming is needed and in verifying if the module(s) match the actual vehicle VIN and if their calibration version is current. This option displays the “In-use Performance Tracking” of data. This is a record of the number of times each of the monitor tests have been completed. Mode ten displays a record of any “permanent” codes. A permanent status DTC is one that was severe enough to illuminate the MIL at some point, but the MIL may not be on at the present time. Whether the MIL was switched off by clearing codes or because the setting conditions did not repeat after a specified number of drive cycles, a record of the DTC is retained by the ECM. Permanent status codes automatically clear after repairs have been made and the module successfully completes it's monitor testing procedure. The criteria for successful monitor testing may include completion of multiple successful drive cycles, or a universal trip drive pattern, refer to OEM service information for details. |
|||||||||||||||||||||||||||||||||||||||||||||||||||||||||||||||||||||||||||||||||||
| Online Forums | ||||||||||||||||||||||||||||||||||||||||||||||||||||||||||||||||||||||||||||||||||||
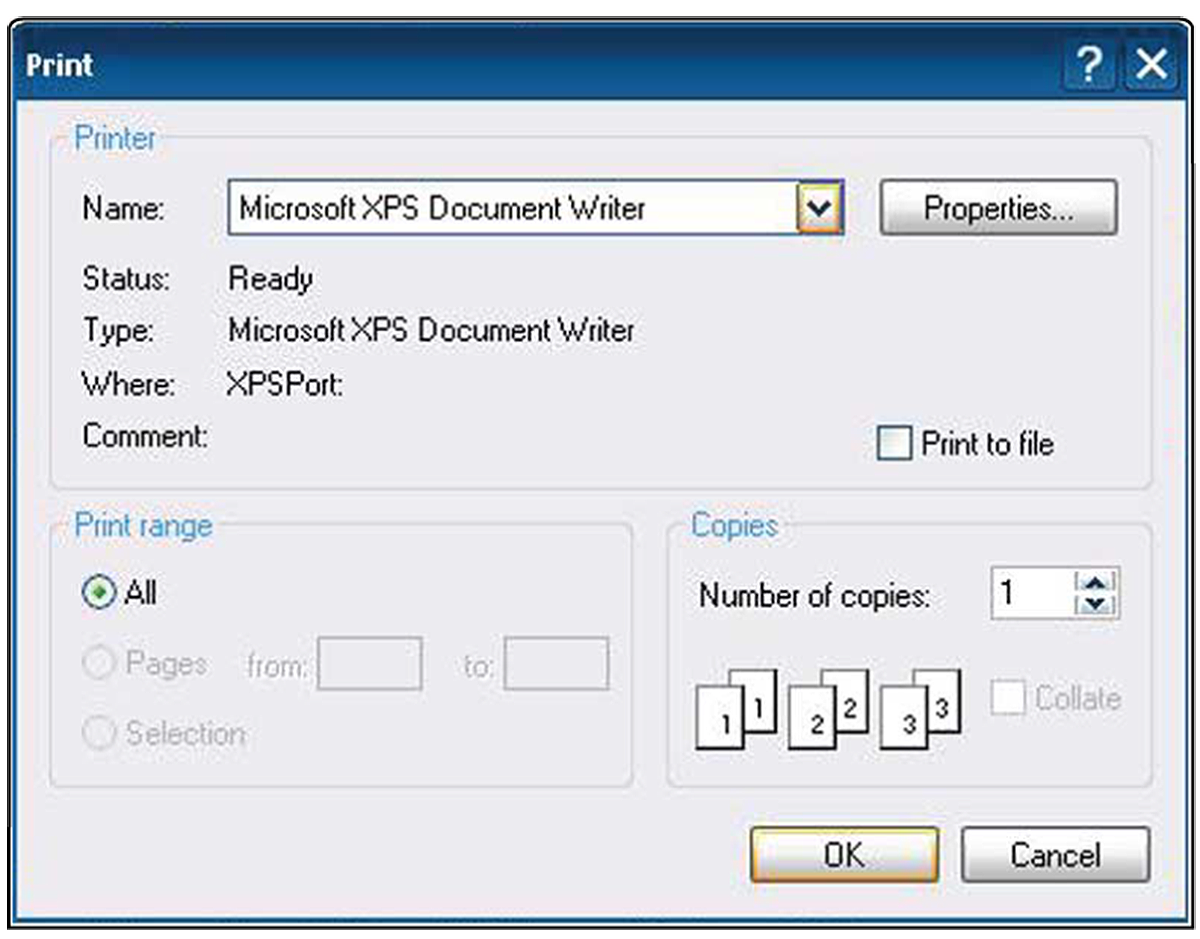
| Printing |
Selecting Print opens a standard Windows Print dialog box. If you have already installed a printer, select it and choose print. To print, a printer must installed and set as the system (Windows) default printer. For data and files that are automatically sent to the Snap-on Cloud, you can print them using your PC or mobile device from the Snap-on Cloud.
For additional information, see the Printer section inside the Windows (Applicable Features / Operations) section in the user manual, or see online Windows Support Information. |
|||||||||||||||||||||||||||||||||||||||||||||||||||||||||||||||||||||||||||||||||||
| Scanner Operations |
No - Your diagnostic tool is not designed for reprogramming. Other tools are available for this type of work, see Pass Thru |
|||||||||||||||||||||||||||||||||||||||||||||||||||||||||||||||||||||||||||||||||||
| Scanner Operations |
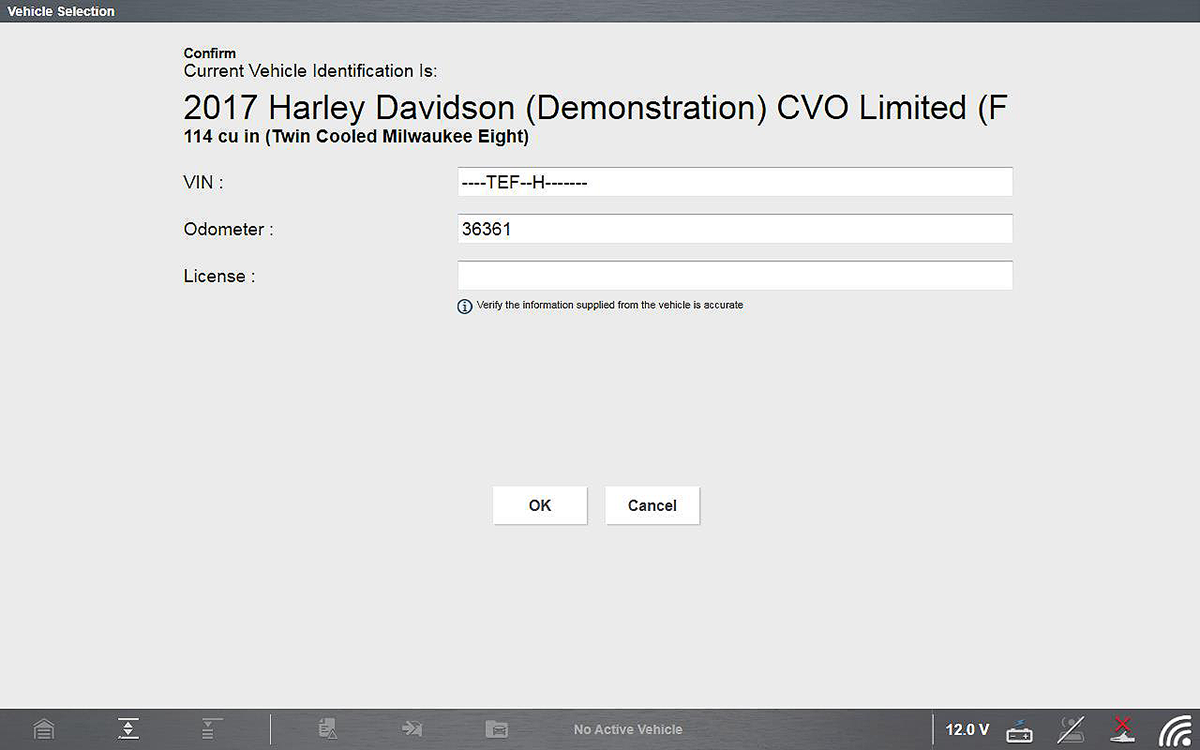
This feature is not applicable to all tools. Depending on the vehicle, the vehicle identification process may be automated or it may require manual entry of the vehicle information. Instant ID - Automatically completes the identification process upon initial communication between diagnostic tool and the vehicle using OBD-II VIN mode $09. Instant ID requires specific vehicle support and procedures. Auto ID - Automatically completes the identification process after the vehicle make and year are manually entered. |
|||||||||||||||||||||||||||||||||||||||||||||||||||||||||||||||||||||||||||||||||||
| Scanner Operations |
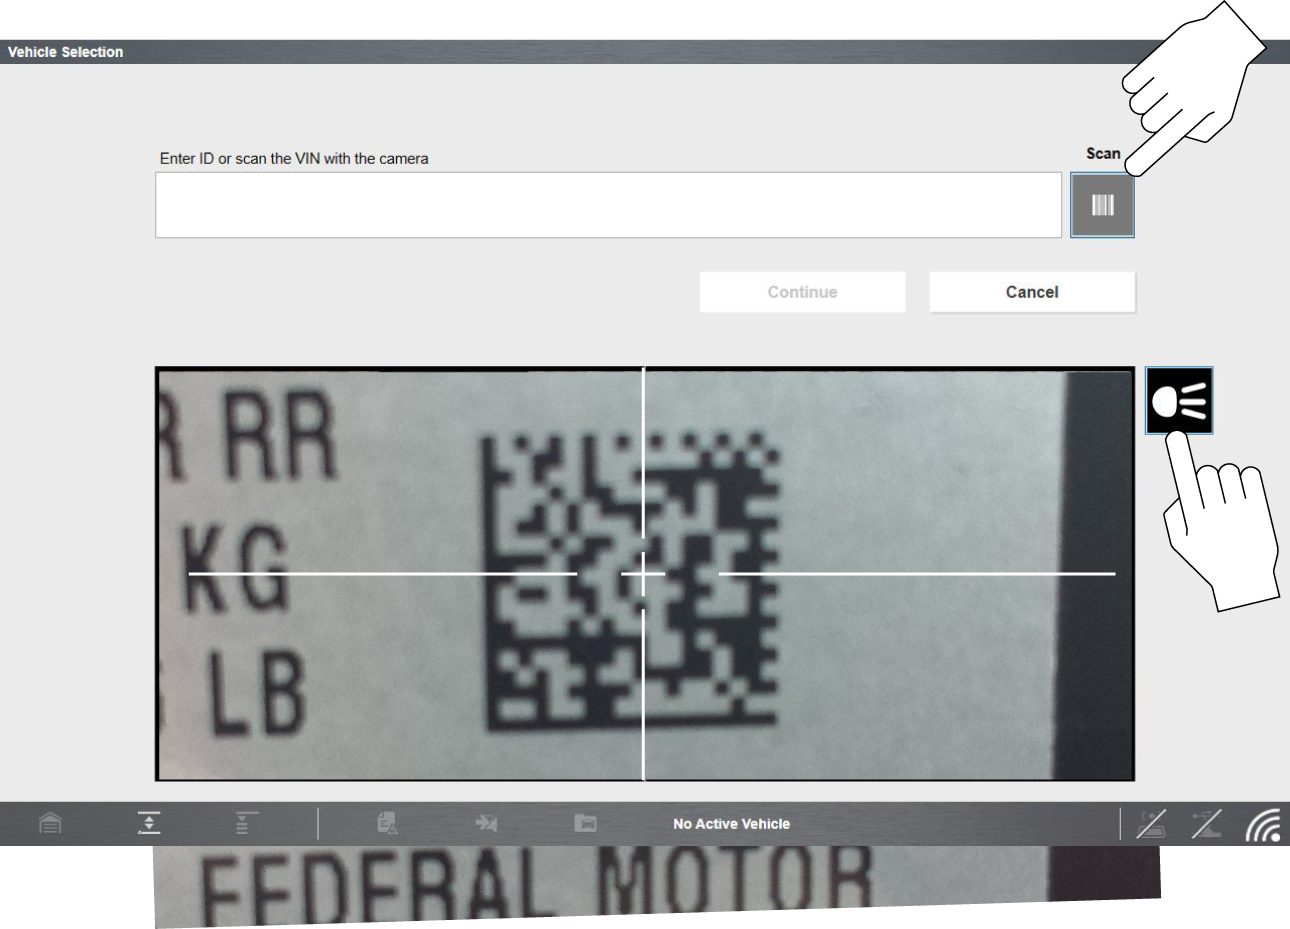
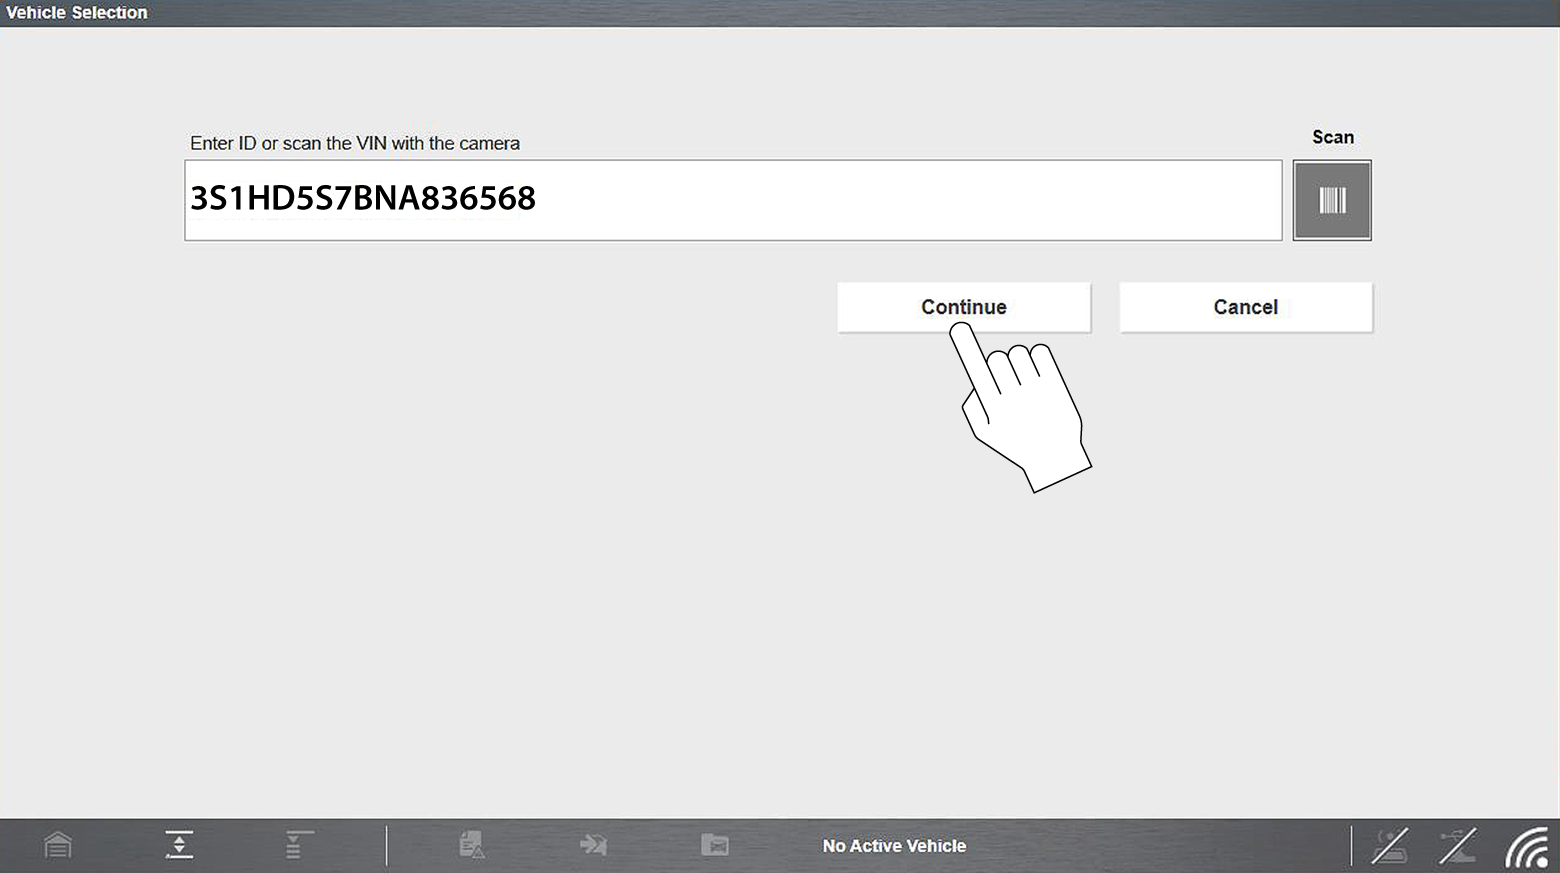
Depending on the vehicle, the vehicle’s VIN barcode or Data Matrix code may be scanned to identify the vehicle. The location of these codes will vary, however they can be commonly found on the drivers side door or door jamb.
If you are having trouble capturing the code, try:
|
|||||||||||||||||||||||||||||||||||||||||||||||||||||||||||||||||||||||||||||||||||
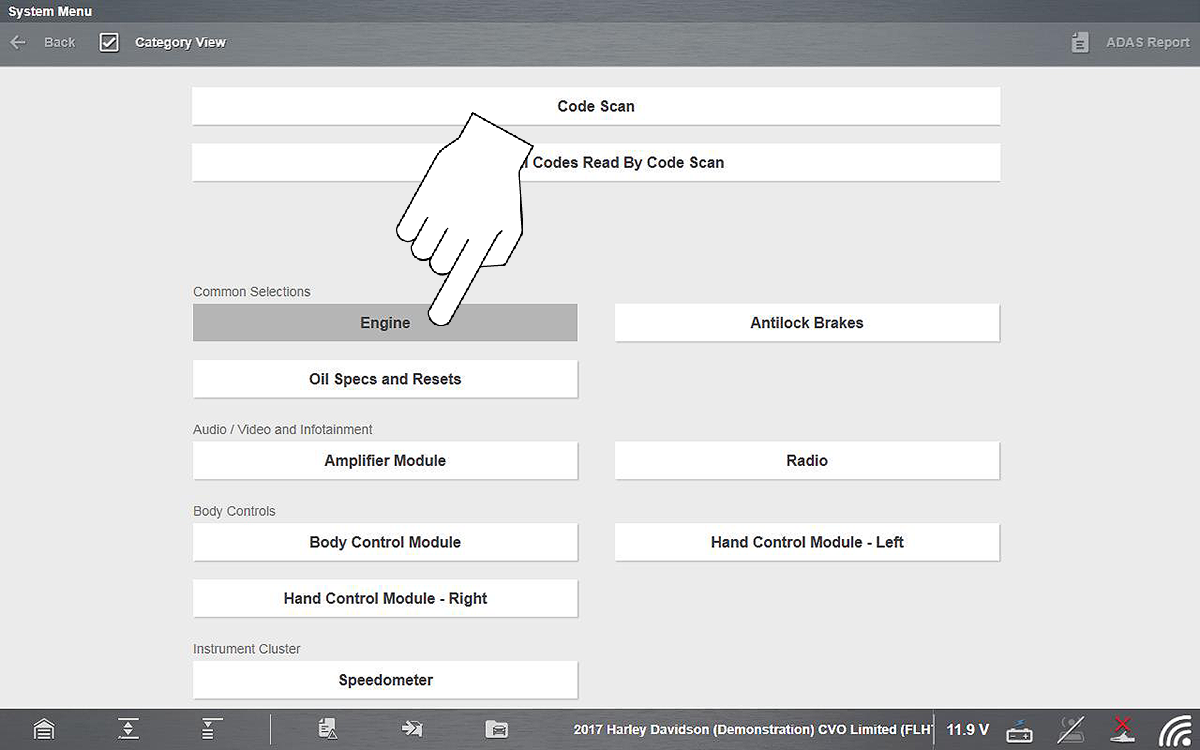
| Scanner Operations |
= Home Screen > Scanner > [ID Vehicle] > Engine > Codes Menu > Display Codes Terminology will vary between makes for the menu choices. As example the selections “Codes Menu” and "Display Codes" (as shown above), may appear as a different names (e.g Codes, Codes Menu, Codes Only, Codes (No Data), Service Codes) or something similar depending on the vehicle manufacturer. Selecting the applicable menu choice (e.g. Display Codes) may open either a list of diagnostic trouble codes (DTCs) for that system or a submenu of DTC viewing options. Depending on your diagnostic tool features, the code list may also include SureTrack® information. SureTrack is an optional service which may provide additional troubleshooting information (e.g. Common Replaced Parts data, Real Fix and Related Fixes) for the selected DTC. |
|||||||||||||||||||||||||||||||||||||||||||||||||||||||||||||||||||||||||||||||||||
| Scanner Operations |
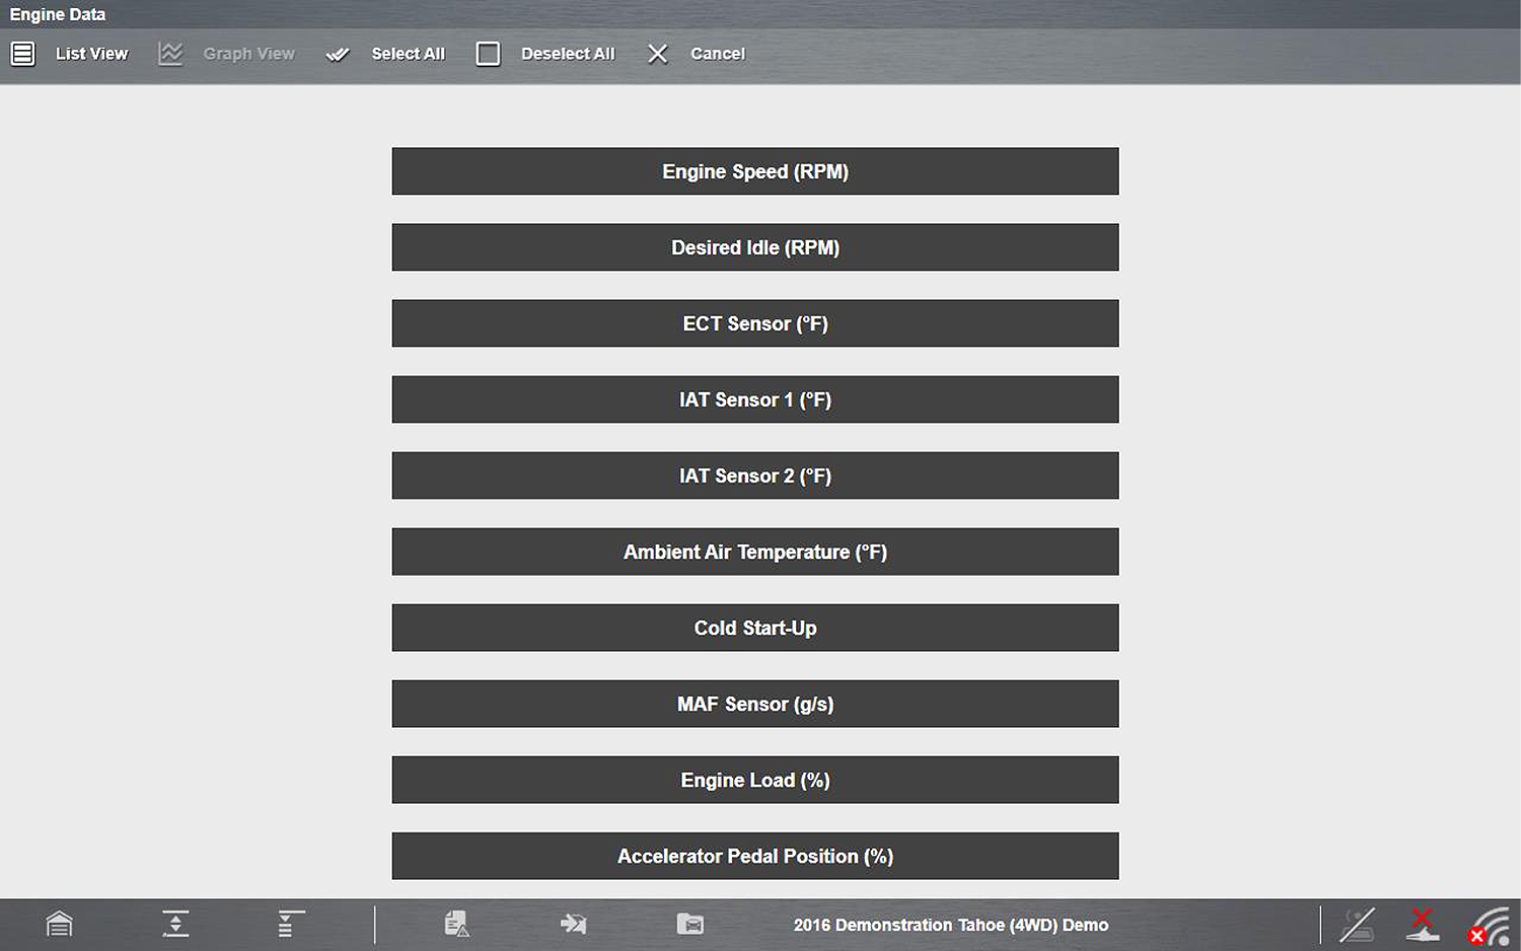
Limiting the number of parameters that display allows for a faster refresh rate of the data.
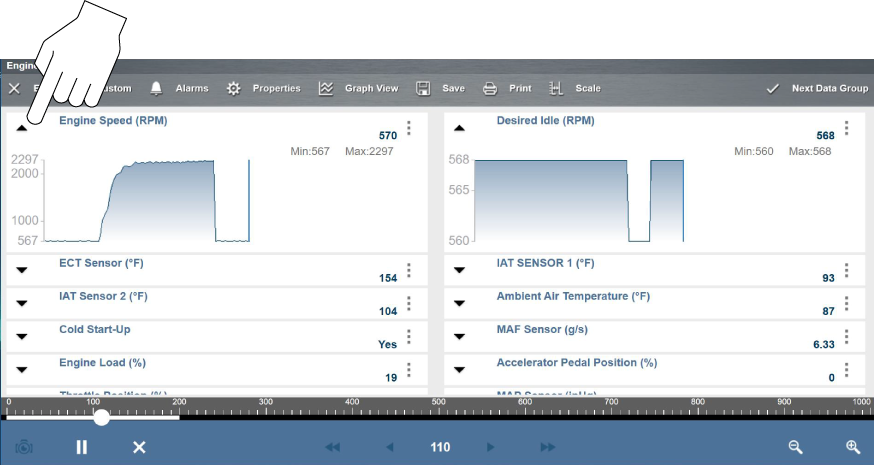
The parameter selection dialog box with all of the parameters selected opens .
Custom configuration (Select All shown) Keep the following in mind when configuring a custom data list:
Graph View is only available when 16 or fewer parameters (the number that can display on a single screen) were selected for the custom list. Make sure that no more than 16 parameters are highlighted if the screen displays a single graph when the Graph View icon is selected. |
|||||||||||||||||||||||||||||||||||||||||||||||||||||||||||||||||||||||||||||||||||
| Scanner Operations |
To view one or more PIDs as a graph from the list view, select the Expand/Collapse icon. To return the PID to list view, select the icon again.
|
|||||||||||||||||||||||||||||||||||||||||||||||||||||||||||||||||||||||||||||||||||
| Scanner Operations |
= Home Screen > Scanner > [ID Vehicle] > [Choose System] > Functional Test Functional Tests are used to access vehicle-specific subsystem tests. Test availability varies by manufacturer, year, and model. Only the tests available/supported for the identified vehicle display in the menu. Follow all screen instructions while performing tests. How and what information is presented on the screen varies according to the type of test being performed and the vehicle being serviced. Functional tests are typically actuated by icons or controls in the upper toolbar designated to turn a component on/off or set testing times or other variables. Types of functional tests will vary:
|
|||||||||||||||||||||||||||||||||||||||||||||||||||||||||||||||||||||||||||||||||||
| Scanner Operations | ||||||||||||||||||||||||||||||||||||||||||||||||||||||||||||||||||||||||||||||||||||
| Scanner Operations |
If the vehicle is OBD-II compliant, typically 1996 and newer you can still get useful data using the OBD function, as this allows you to access “generic” OBD-II/EOBD data. The OBD Direct icon Generic OBD-II/EOBD data is limited to emission related diagnostics and allows you to access:
|
|||||||||||||||||||||||||||||||||||||||||||||||||||||||||||||||||||||||||||||||||||
| Scanner Operations |
Communication protocols provide a standardized way of transferring data between an ECM and a diagnostic tool. Global OBD may use the following communication protocols:
When initially attempting to establish communication with the ECM the diagnostic tool attempts to communicate trying each protocol in order to determine which one is being used. During normal operation the communication protocol is automatically detected. If automatic detection fails, communication protocol can be manually selected. To manually set the protocol, see OBD Direct > Manual Protocol Selection Using unsupported OBD communication protocols may activate warning lights and can set network related faults. Only use the manual selection option when OBD protocol is already known. |
|||||||||||||||||||||||||||||||||||||||||||||||||||||||||||||||||||||||||||||||||||
| Scanner Operations |
Fast Track Intelligent Diagnostics provides access to code related data, information, and tests, all from one screen when viewing codes in Scanner. Quickly find TSB's, smart data PID lists, out-of-range PIDs, functional tests, Top Repairs Graph and Real Fixes, all related to the selected code. In addition, you can directly access all (not just code related) PIDs and functional tests from one place, as compared to accessing them separately through the individual system menu.
|
|||||||||||||||||||||||||||||||||||||||||||||||||||||||||||||||||||||||||||||||||||
| Scanner Operations |
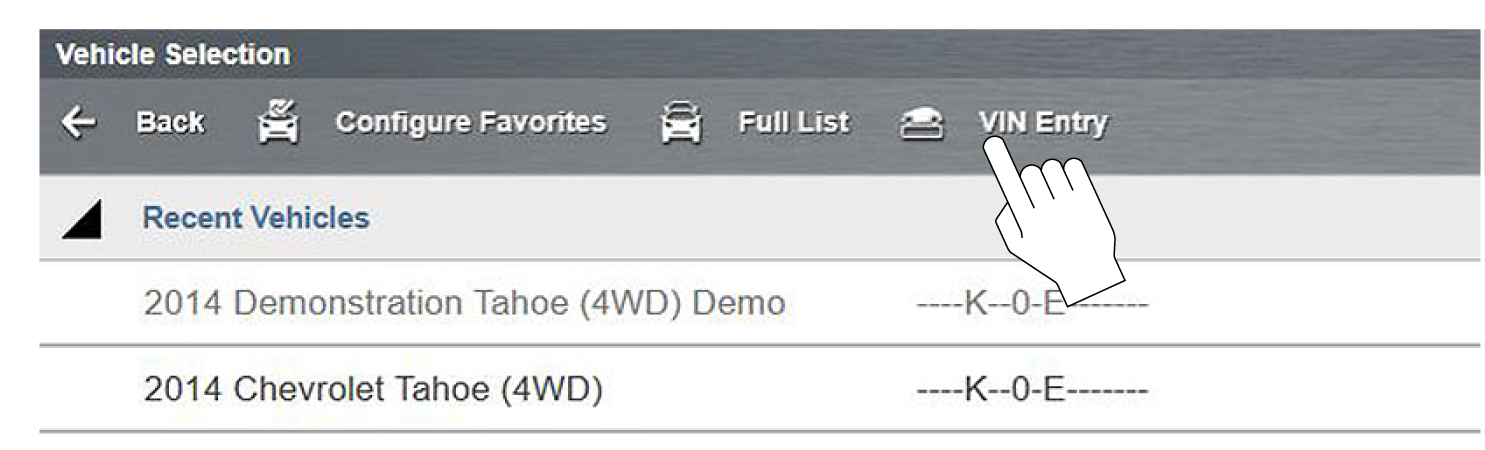
On the "Select Make" screen when you are selecting the vehicle OEM, select Configure Favorites from the upper toolbar. This feature allows you to custom configure the manufacturer list to display only the makes you frequently service. Select each manufacturer you want to include, then select Finished to save the list. Manufacturers appear on the favorites list in the order in which they are selected. Therefore, if you select the makes you work on most frequently first, they will appear at the top of the list. After saving a custom list the “Favorites” toolbar selection now displays a “Full list” option also. Select Full List on the toolbar to view the complete list of manufacturers. |
|||||||||||||||||||||||||||||||||||||||||||||||||||||||||||||||||||||||||||||||||||
| Scanner Operations |
See SureTrack (opens in new tab). |
|||||||||||||||||||||||||||||||||||||||||||||||||||||||||||||||||||||||||||||||||||
| Scanner Operations |
Yes, but in a somewhat unconventional manner. Watch this video to see how you can do this. (Note- this video shows a VERUS diagnostic tool, but the functionality can used on our VERUS and ZEUS family of tools.) Regardless of which Scanner function you use (i.e. viewing PIDs, functional test, etc), you can open the Scope Viewer window from Guided Component Tests (GCT) and pop it out into a separate window. This allows you to view Scanner data and use the Lab Scope simultaneously. Tip - Use this with an external monitor connected to view Scanner and Scope data on separate monitors. |
|||||||||||||||||||||||||||||||||||||||||||||||||||||||||||||||||||||||||||||||||||
| Scope / Meter Operations |
Leads and probes are supplied with your diagnostic tool. Their recommended connection is as follows. The shielded yellow lead is used with channel 1, and is color matched with the channel 1 jack on the diagnostic tool. This lead also includes two black, right-angle common ground plugs. One plug is standard and the other is stackable. The standard ground plug should always be connected to the ground (GND) jack on the diagnostic tool.
The stackable ground plug is used for connecting additional ground leads, such as the Channel 2 or the Secondary Coil Adapter lead grounds. The stackable ground lead is internally connected to the standard ground lead, therefore it does not need to be connected to the diagnostic tool ground jack. The shielded green lead is used with channel 2, and is color matched with the channel 2 jack on the diagnostic tool. This lead also includes a black, right-angle stackable ground plug.
Insulated alligator clips and probes (pointed type) can be attached to the end of the test leads. Each alligator clip is color matched with a test lead, and the probes are available in red and black.
To purchase leads, probes and related equipment, contact your Snap-on representative and/or visit Diagnostic Tools and Accessories |
|||||||||||||||||||||||||||||||||||||||||||||||||||||||||||||||||||||||||||||||||||
| Scope / Meter Operations |
An optional Low Amp Current Probe is used measure AC or DC current up to 60A. This probe includes two scales (0 to 20A) and (0 to 60A) that can be used to provide accurate and reliable non-intrusive current measurement for components such as, ignition coils, fuel injectors, fuel pumps, relays, and electric motors.
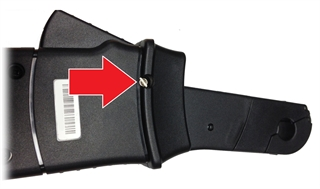
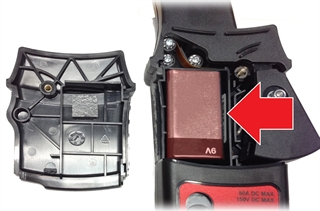
For more information, contact your Snap-on representative and/or visit Diagnostic Tools and Accessories Battery Replacement The RED LED flashes when the minimum operating voltage is approached, indicating that the battery needs to be replaced. When replacing the battery, use the 9-volt alkaline type only. Using any other type of battery in the Snap-on Low Amp Current Probe will invalidate your warranty. To replace the battery:
|
|||||||||||||||||||||||||||||||||||||||||||||||||||||||||||||||||||||||||||||||||||
| Scope / Meter Operations |
Different pressure transducers and adapters are available for measuring positive and negative gas and liquid pressures. Depending on the adapter, measurement capabilities range from 1 to 5000 psi and up to 29 inHg. Measurement and application capabilities vary per device. For ZEUS+ use pressure transducer adapter EEMS324PSA and applicable transducer/cable kit. The EEMS324PSA Pressure Transducer Adapter allows the use of pressure transducers with the diagnostic tool. It provides 2 channel input and provides power to the pressure transducers. Typical applications include ABS, PS, transmissions, hydraulics, and fuel system tests. The Pressure Transducer Adapter has a LED power indicator, On/Off switch, three color-coded 12” flexible leads with insulated connectors, and requires a 9V battery, which is included. Transducer/cable kits listed below are not included. 0-100 PSI Pressure Transducer - Part# EEPV302AL 0-500 PSI Pressure Transducer - Part# EEPV302AT 0-5000 PSI Pressure Transducer - Part# EEPV302AH
For more information, contact your Snap-on representative and/or visit Diagnostic Tools and Accessories |
|||||||||||||||||||||||||||||||||||||||||||||||||||||||||||||||||||||||||||||||||||
| Scope / Meter Operations |
|
|||||||||||||||||||||||||||||||||||||||||||||||||||||||||||||||||||||||||||||||||||
| Scope / Meter Operations |
|
|||||||||||||||||||||||||||||||||||||||||||||||||||||||||||||||||||||||||||||||||||
| Scope / Meter Operations |
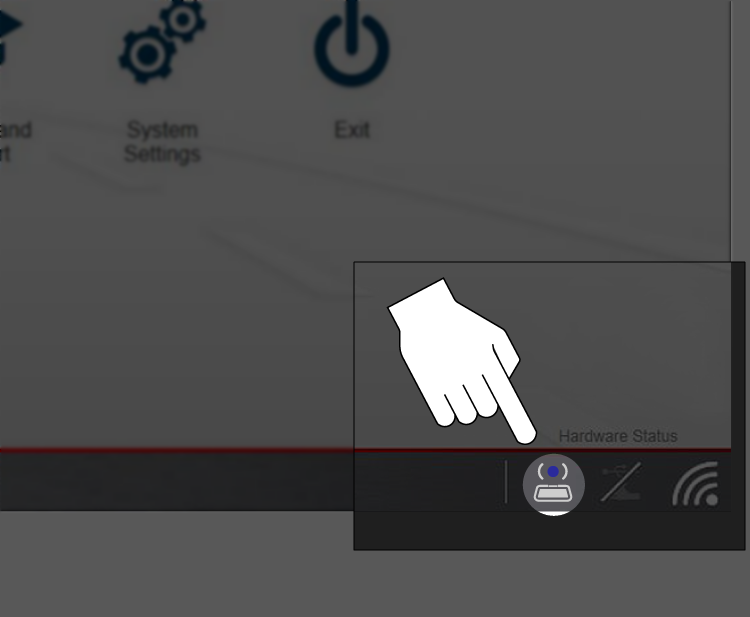
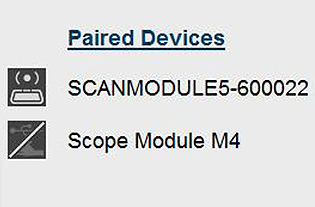
When the Scope Module is connected (via USB cable), it automatically pairs with the diagnostic tool. To pair the Scope Module, connect it using the USB cable then check the connection status by selecting.... = Home Screen > System Settings > Paired Devices The Paired Devices screen lists all of the devices paired to the diagnostic tool, and also indicates whether or not there is active communication occurring. The Scope Module will be listed as SCOPE MODULE M4 or similar.
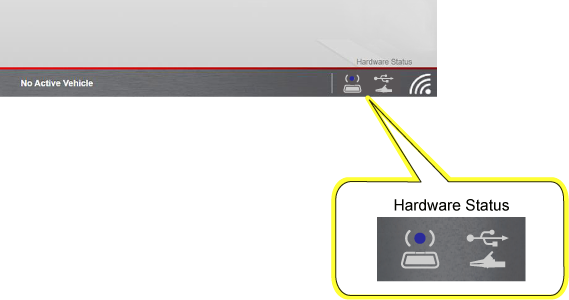
If the Scope Module is not shown in the Paired Devices list, check to make sure it has a good connection. Use the Hardware Status icons shown below to determine connection status,. The hardware status indicators in the lower-right corner of the Home screen.
|
|||||||||||||||||||||||||||||||||||||||||||||||||||||||||||||||||||||||||||||||||||
| Scope / Meter Operations |
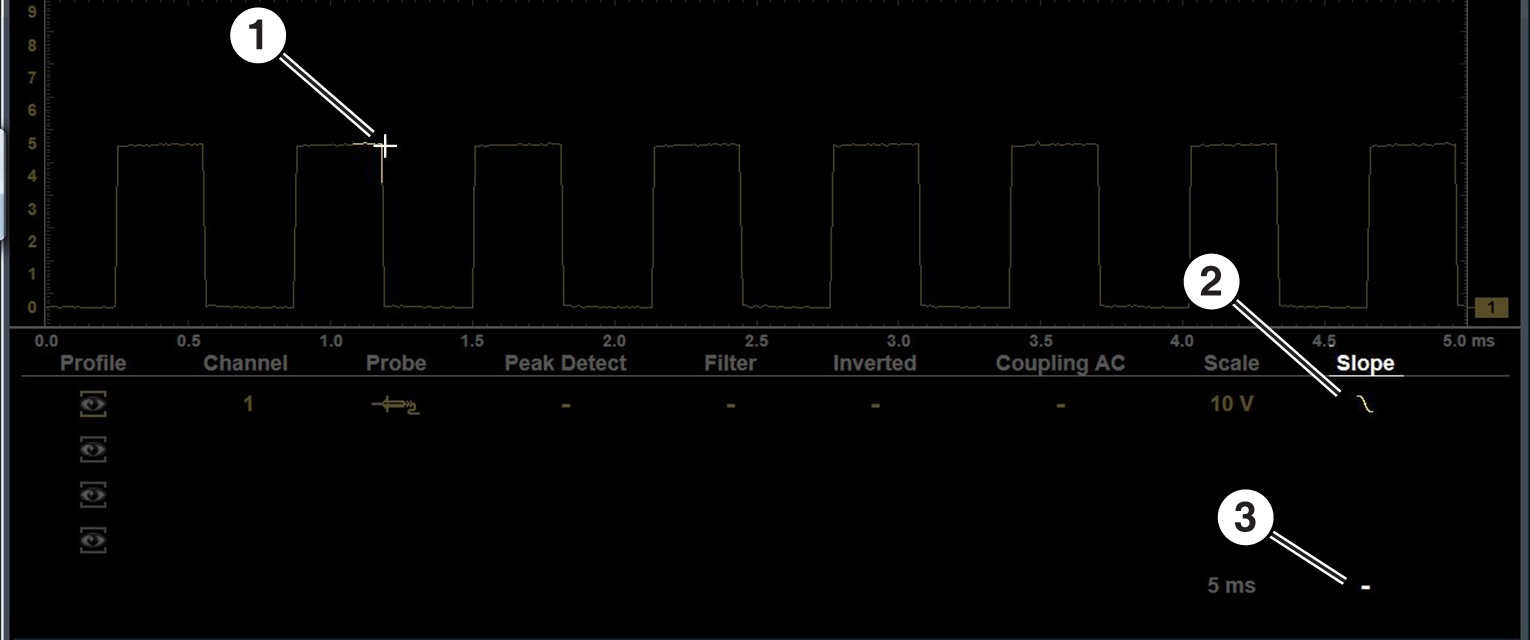
Triggers are only available in the lab scope function. A trigger can be used to stabilize a changing or erratic signal (a signal that may flicker or drift as it refreshes), so that it is easier to view or diagnose. This stabilization effect is accomplished by basically displaying the same part of the trace repeatedly from the same starting point, thus the flicker or drift is minimized. A trigger is basically a “specific point” on the display, at which a trace will start to display (start the sweep) if it crosses that point. The trigger feature allows you to set the conditions of that “specific point” also called a “trigger point”. When the trigger conditions are set, and a trace “meets” those conditions (crosses the trigger point), the trace will start. Trigger conditions:
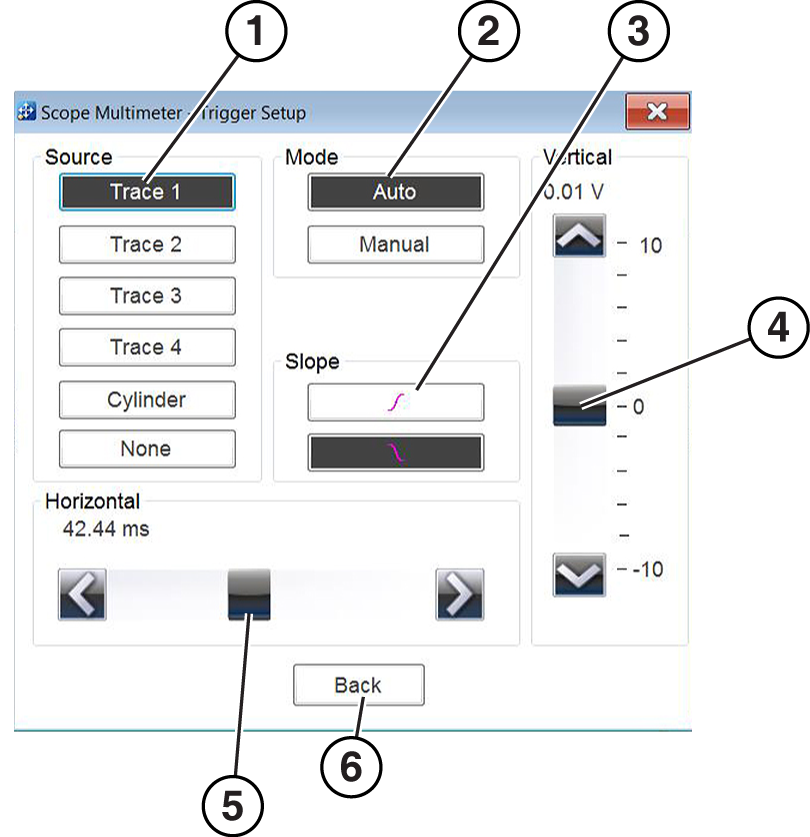
Triggers can be set on any channel, however only one trigger can be activated (used) at a time. The trigger point is indicated by a plus marker (+) on the scope grid. The trigger marker sign can be dragged across the grid with the stylus to roughly position it. The trigger setup menu allows you to precisely position the trigger. To access the trigger setup menu:
Trace 1 to 4—sets the trigger for the applicable channel. Cylinder—sets triggering to the firing of a cylinder detected by the optional RPM Pickup or Secondary Ignition Adapter. None—switches triggering off.
Trigger Auto/Manual The Auto and Manual Trigger modes allow you to set the criteria used to display signals on the screen. To change the trigger mode, the trigger must be set on one of the channels. In both Auto and Manual Trigger mode the screen is updated when the signal crosses the trigger point in the selected direction (rising or falling), however:
When using Manual Trigger, it may be easier to initially set the trigger point using Auto Trigger, as the screen will update regardless if the signal crosses the trigger point. Once the trigger point is set, then switch to Manual Trigger mode. Trigger Slope Icons Trigger slope icons are displayed in the control panel.
Turning Triggers on/off A trigger can be turned on by:
A trigger can be turned off by:
Setting Trigger Position The trigger marker is indicated by a plus graphic (+) on the display. The trigger marker represents the trigger point and is displayed on the screen when the trigger is turned on.
|
|||||||||||||||||||||||||||||||||||||||||||||||||||||||||||||||||||||||||||||||||||
| Scope / MultiMeter Operations |
The graphing multimeter(GMM) provides two channels for testing and plots a visual graphing line of the signal. The GMM uses a higher sample rate (than a DMM) to calculate signal measurements. This characteristic along with the visual graph, make the GMM ideal for finding intermittent dropouts or glitches that may not be obvious when viewing a digital value. A key advantage of the GMM is being able to capture a signal over a long time interval and then review it’s graphical history, to visually see if and when dropouts have occurred. The Lab Scope provides two channels for testing and allows you to visually see a signals waveform, which in turn allows you to see the strength and shape of the signal. The lab scope also samples signals at a high rate, which allows you to see a higher level of detail in short samples of the signal, especially in signals that change rapidly. In addition, the lab scope also provides more control over the acquisition of the signal and in how it is displayed, through the use of triggers and channel controls. All of these features allow you to analyze signals in great detail when performing component testing. To use these functions, open as shown below = Home Screen > Scope / Multimeter>(Lab Scope, Graphing Multimeter or Digital Multimeter) Connect the supplied test leads and probes as applicable using one or both channels and the ground lead. See How do I connect the meter leads to the tool? For additional information, within this User Manual application, see Main Menu > Diagnostic Tool Functions > Scope / MultiMeter. |
|||||||||||||||||||||||||||||||||||||||||||||||||||||||||||||||||||||||||||||||||||
| Secure Vehicle Gateways |
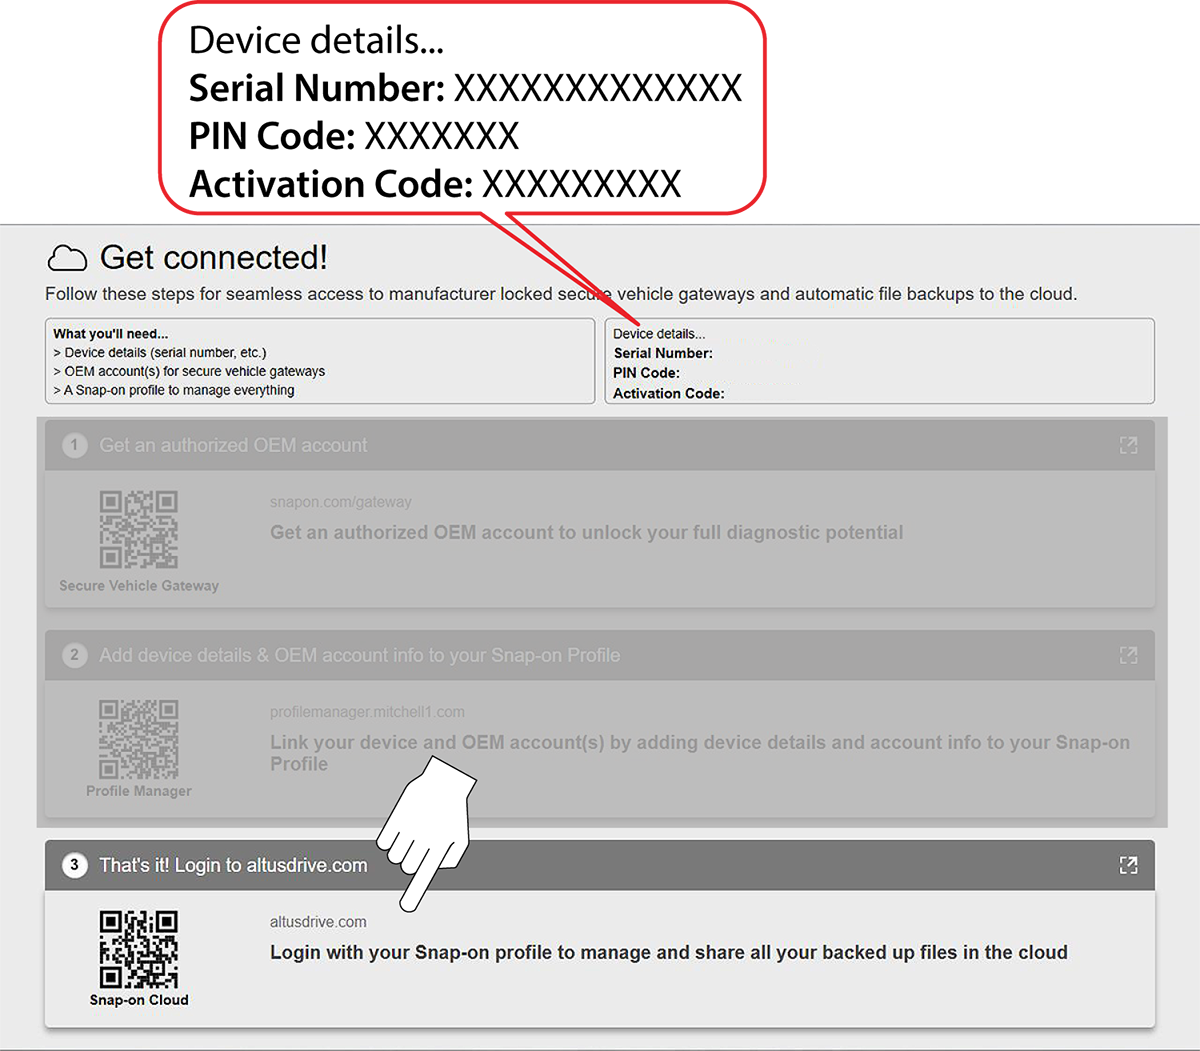
To protect vehicle communication networks from unauthorized access, OEM’s are implementing Security Link modules that only allow authorized users to access certain diagnostic functions using an approved diagnostic tool. Using Security Link and your Snap-on diagnostic tool, you can have the ability to communicate with most vehicles that are equipped with Security Link modules. Currently Security Link is only compatible with Fiat Chrysler Automobiles (FCA) 2018+ models. How do I get setup to use it, so I can connect to vehicles with Secure Vehicle Gateways?
For more information on how to setup these accounts and get authorized: See Security Link™ (opens new tab) Before you can use Security Link , you need to create a Snap-on Technician Profile, see Snap-on® Techincian Profile (opens new tab). |
|||||||||||||||||||||||||||||||||||||||||||||||||||||||||||||||||||||||||||||||||||
| Snap-on Cloud |
Get Connected allows you view the diagnostic tool serial number, PIN and Code needed to create a Snap-on Technician Profile, which then allows you to use companion applications, like the Cloud and Security Link. = Home Screen > System Settings > Get Connected The numbers and codes needed to create your Snap-on Profile account are found on your diagnostic tool (see image below). The device Serial Number, PIN and Code needed to register are displayed onscreen.
|
|||||||||||||||||||||||||||||||||||||||||||||||||||||||||||||||||||||||||||||||||||
| Snap-on Cloud |
Snap-on Cloud is a mobile-friendly cloud-based application designed specifically for technicians to store, organize and share information. For setup help, see Snap-on Cloud (opens new tab) Using Snap-on Cloud (ALTUSDRIVE.com) allows you to:
To access and use the Snap-on Cloud you need to first setup a Snap-on® Technician Profile (opens new tab). |
|||||||||||||||||||||||||||||||||||||||||||||||||||||||||||||||||||||||||||||||||||
| Snap-on Technician Profile |
Before you can use the Snap-on Cloud or Security Link applications, you need to create a Snap-on Technician Profile. |
|||||||||||||||||||||||||||||||||||||||||||||||||||||||||||||||||||||||||||||||||||
| Software |
Software license agreements are integrated into the software and are "accepted" when the tool is initially activated and whenever a new software upgrade is installed. Use of Software is governed by the terms and conditions of the End User License Agreement. The diagnostic tool should not be initially operated until the End User License Agreement is read. Use of the device acknowledges your acceptance of the End User License Agreement. The Snap-on Incorporated Software End User License Agreement may be provided with the diagnostic tool, and is available at: https://eula.snapon.com/diagnostics For customer and end-user access and convenience, Snap-on is providing the End User License Agreements (link above) applicable to the Snap-on Diagnostics software and platforms. These agreements or an earlier one you agreed to was either provided as hard copy or resident within the diagnostics platform software. |
|||||||||||||||||||||||||||||||||||||||||||||||||||||||||||||||||||||||||||||||||||
| Software |
The diagnostic tool serial number is located (decal) on the back of the diagnostic tool housing and under the battery pack.
It is also displayed on the Get Connected screen: Home Screen > System Settings > Get Connected
|
|||||||||||||||||||||||||||||||||||||||||||||||||||||||||||||||||||||||||||||||||||
| Software | ||||||||||||||||||||||||||||||||||||||||||||||||||||||||||||||||||||||||||||||||||||
| SureTrack |
If you have recently purchased a software upgrade, you will need to reactivate your account to access SureTrack Community. See SureTrack Help (opens in new tab) |
|||||||||||||||||||||||||||||||||||||||||||||||||||||||||||||||||||||||||||||||||||
| SureTrack |
See SureTrack Help (opens in new tab) |
|||||||||||||||||||||||||||||||||||||||||||||||||||||||||||||||||||||||||||||||||||
| Troubleshooting |
Check the power source. Ensure the battery is installed, in good condition and fully charged. If the tool will not power up by battery, connect the AC power supply. If you are still experiencing difficulties, contact customer support Phone
|
|||||||||||||||||||||||||||||||||||||||||||||||||||||||||||||||||||||||||||||||||||
| Troubleshooting |
In situations where the display is frozen and is not responding to touch screen actions or control buttons, it may be necessary to perform an emergency shutdown. It is not recommended to do this during active vehicle communication, try to exit vehicle communication before shutting down.
The display screen will turn off and the battery charge LED will turn red and begin blinking.
If you are still experiencing difficulties, contact customer support Phone
|
|||||||||||||||||||||||||||||||||||||||||||||||||||||||||||||||||||||||||||||||||||
| Vehicle History |
= Home Screen > Vehicle History |
|||||||||||||||||||||||||||||||||||||||||||||||||||||||||||||||||||||||||||||||||||
| Vehicle Specific Information |
= Home Screen > Quick Lookups > Oil Specs and Resets |
|||||||||||||||||||||||||||||||||||||||||||||||||||||||||||||||||||||||||||||||||||
| Vehicle Specific Information |
= Home Screen > Quick Lookups > Tire and Wheel Service |
|||||||||||||||||||||||||||||||||||||||||||||||||||||||||||||||||||||||||||||||||||
| Vehicle Specific Information |
ShopKey Pro is a specialized subscription service that provides OEM repair information, procedures, TSBs, wiring diagrams, and much more. In addition it has shop management capabilities like estimating, ordering and more. Visit ShopKey Pro to learn more. |
|||||||||||||||||||||||||||||||||||||||||||||||||||||||||||||||||||||||||||||||||||
| Vehicle Specific Information |
|
|||||||||||||||||||||||||||||||||||||||||||||||||||||||||||||||||||||||||||||||||||
| Vehicle Specific Information |
Visit ShopKey Pro to learn more. |
|||||||||||||||||||||||||||||||||||||||||||||||||||||||||||||||||||||||||||||||||||
| Videos |
Videos are provided for most tools at:
|
|||||||||||||||||||||||||||||||||||||||||||||||||||||||||||||||||||||||||||||||||||
| Warranty |
Use our online registration form to create and submit your contact information. Registering your diagnostic tool allows you to obtain warranty assistance and receive periodic messages from Snap-on about current products, features and promotions. Register online (United States) : https://registration.snapon.com/products/DiagProductRegistration.aspx Register online (Canada) : snapon.com/productregistration |
|||||||||||||||||||||||||||||||||||||||||||||||||||||||||||||||||||||||||||||||||||
| Wi-Fi |
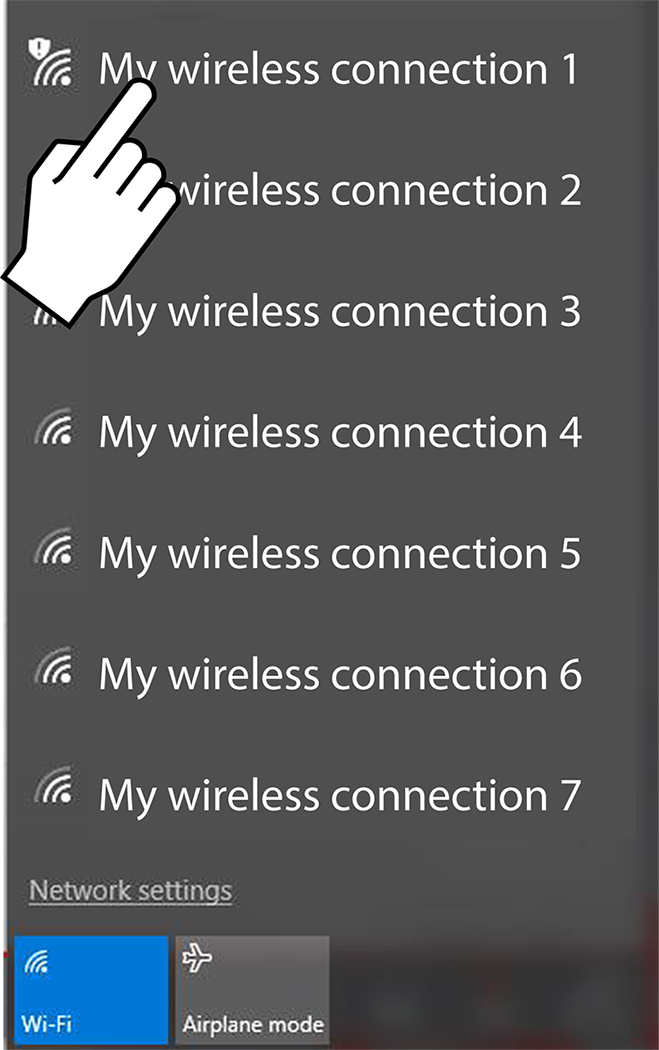
Whenever the diagnostic tool is turned on, Wi-Fi will automatically try to connect to a network.
After bootup you can check if Wi-Fi is connected, by looking for the Wi-Fi indicator in the System Tray (lower right side), or in the Diagnostic Suite lower toolbar.
The wireless network connection window opens (shown below).
A password is required when choosing a protected network. A wireless network connection progress window displays as the connection is being made.
Wi-Fi performance varies depending on your wireless network equipment and ISP. |
|||||||||||||||||||||||||||||||||||||||||||||||||||||||||||||||||||||||||||||||||||
| Windows OS |
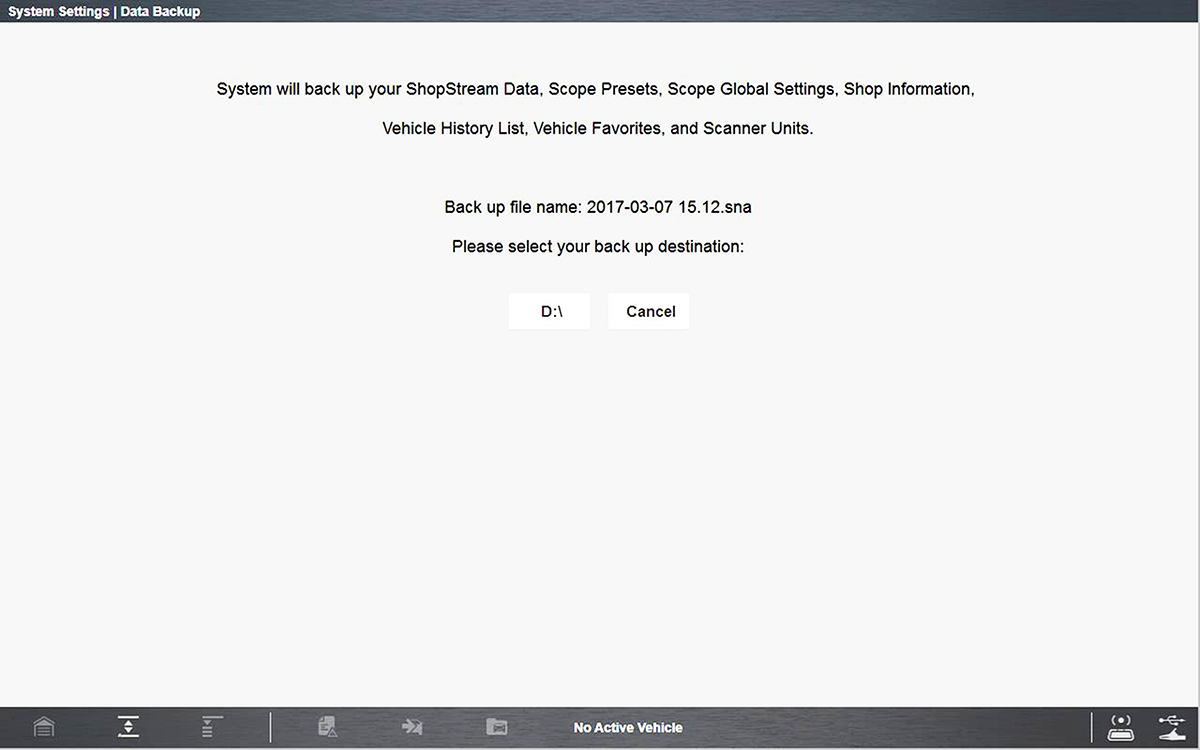
The destination drive dialog box opens.
Drive designations (e.g. E:, F: etc.), are only visible when external drives are connected to the diagnostic tool.
A progress screen is displayed as the backup file is saved to the root of the drive selected with a file extension of .sna. Then a confirmation screen is displayed.
|
|||||||||||||||||||||||||||||||||||||||||||||||||||||||||||||||||||||||||||||||||||
| Windows OS |
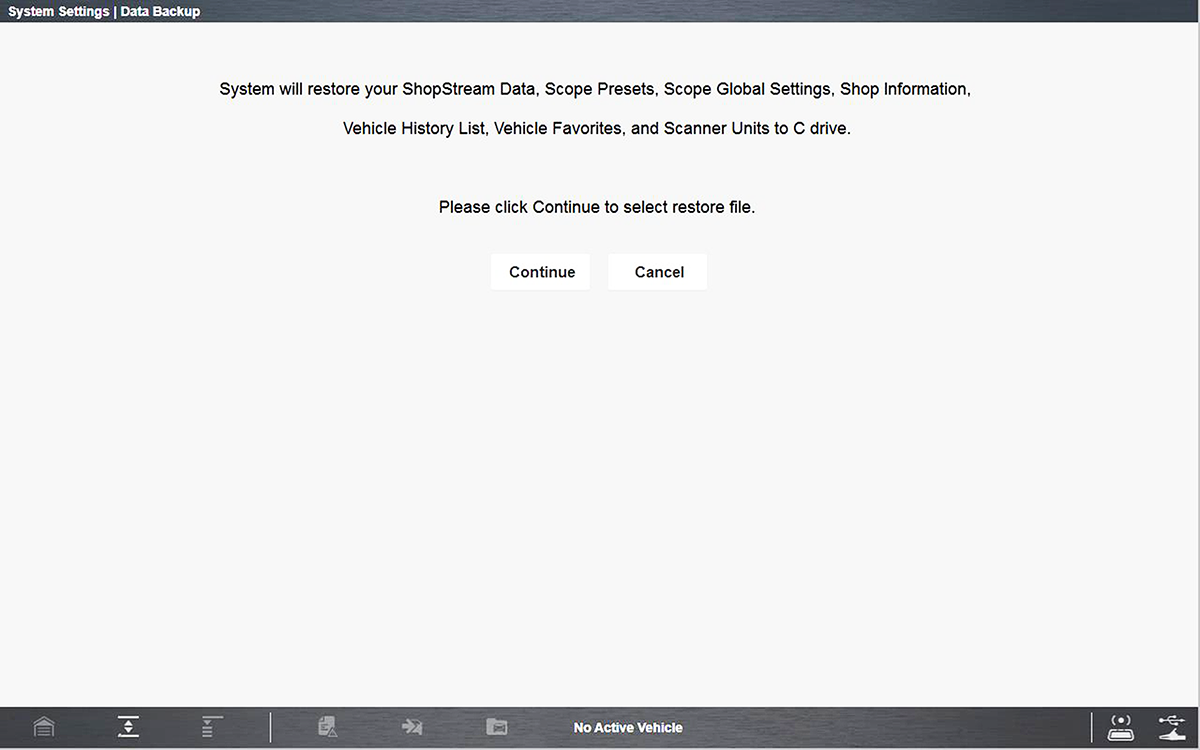
The Restore option is used to restore your backed up data, in the event that the data is lost or if a system restore (recovery) has been performed. This function is only applicable when a backup file has been previously saved (file extension .sna). See Backup (above) for additional information.
The restore file confirmation dialog box opens .
The Windows restore backup file path dialog box opens.
Once the file has been restored a confirmation message is displayed.
|
|||||||||||||||||||||||||||||||||||||||||||||||||||||||||||||||||||||||||||||||||||
|
Windows OS |
This procedure clears the hard drive and restores the original factory operating system image. Before you start, perform a data backup and save any files you may need to an external USB drive. IMPORTANT - All user installed applications, files and folders will be permanently deleted.
|
|||||||||||||||||||||||||||||||||||||||||||||||||||||||||||||||||||||||||||||||||||
| Windows OS |
Your diagnostic tool delivers exclusive coverage, more capabilities, superior performance and runs on a special version of the Microsoft® Windows® 10 operating system. DO NOT install another operating system on this diagnostic tool. The modification or installation of a different OS or OS version will damage the diagnostic tool and void its warranty. |
|||||||||||||||||||||||||||||||||||||||||||||||||||||||||||||||||||||||||||||||||||
| Not Finding an Answer to My Question / Contact Customer Support |
In the United States and Canada: Website
Phone
Online Contact Form
|


 , then press the Screen Capture
  icon .
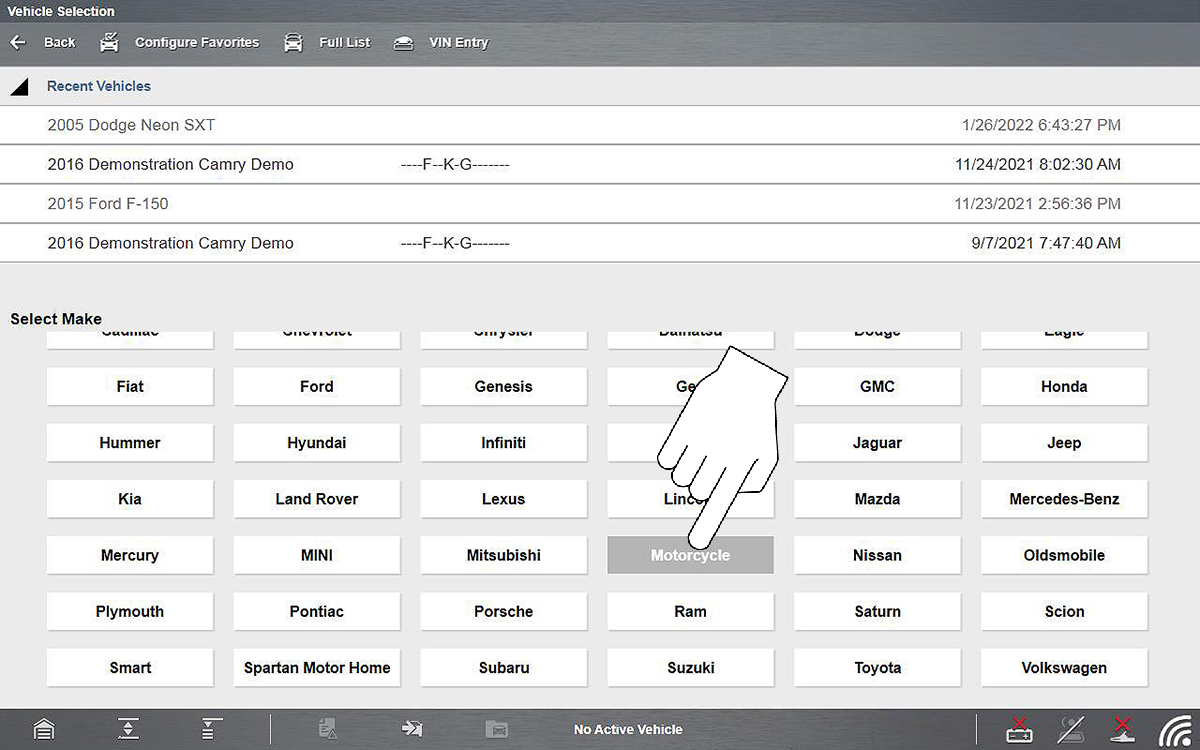
 is located on the Home screen.


 Select the
  The Quick Lookups feature provides access to vehicle manufacturer, Engine Oil Specifications, Oil Service Reset Information
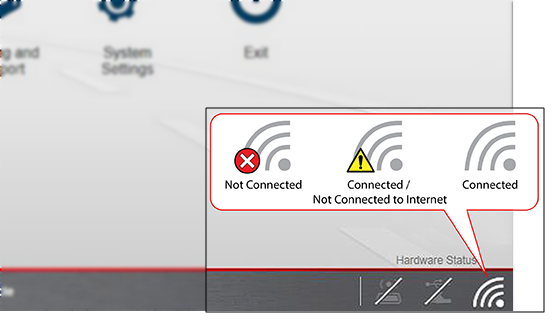
 .
.